Citibank 2012 Annual Report Download - page 203
Download and view the complete annual report
Please find page 203 of the 2012 Citibank annual report below. You can navigate through the pages in the report by either clicking on the pages listed below, or by using the keyword search tool below to find specific information within the annual report.-
 1
1 -
2
-
3
-
4
-
5
-
6
-
7
-
8
-
9
-
10
-
11
-
12
-
13
-
14
-
15
-
16
-
17
-
18
-
19
-
20
-
21
-
22
-
23
-
24
-
25
-
26
-
27
-
28
-
29
-
30
-
31
-
32
-
33
-
34
-
35
-
36
-
37
-
38
-
39
-
40
-
41
-
42
-
43
-
44
-
45
-
46
-
47
-
48
-
49
-
50
-
51
-
52
-
53
-
54
-
55
-
56
-
57
-
58
-
59
-
60
-
61
-
62
-
63
-
64
-
65
-
66
-
67
-
68
-
69
-
70
-
71
-
72
-
73
-
74
-
75
-
76
-
77
-
78
-
79
-
80
-
81
-
82
-
83
-
84
-
85
-
86
-
87
-
88
-
89
-
90
-
91
-
92
-
93
-
94
-
95
-
96
-
97
-
98
-
99
-
100
-
101
-
102
-
103
-
104
-
105
-
106
-
107
-
108
-
109
-
110
-
111
-
112
-
113
-
114
-
115
-
116
-
117
-
118
-
119
-
120
-
121
-
122
-
123
-
124
-
125
-
126
-
127
-
128
-
129
-
130
-
131
-
132
-
133
-
134
-
135
-
136
-
137
-
138
-
139
-
140
-
141
-
142
-
143
-
144
-
145
-
146
-
147
-
148
-
149
-
150
-
151
-
152
-
153
-
154
-
155
-
156
-
157
-
158
-
159
-
160
-
161
-
162
-
163
-
164
-
165
-
166
-
167
-
168
-
169
-
170
-
171
-
172
-
173
-
174
-
175
-
176
-
177
-
178
-
179
-
180
-
181
-
182
-
183
-
184
-
185
-
186
-
187
-
188
-
189
-
190
-
191
-
192
-
 193
193 -
 194
194 -
 195
195 -
 196
196 -
 197
197 -
 198
198 -
 199
199 -
 200
200 -
 201
201 -
 202
202 -
 203
203 -
 204
204 -
 205
205 -
 206
206 -
 207
207 -
 208
208 -
 209
209 -
 210
210 -
 211
211 -
 212
212 -
 213
213 -
214
-
215
-
216
-
217
-
218
-
219
-
220
-
221
-
222
-
223
-
224
-
225
-
226
-
227
-
228
-
229
-
230
-
231
-
232
-
233
-
234
-
235
-
236
-
237
-
238
-
239
-
240
-
241
-
242
-
243
-
244
-
245
-
246
-
247
-
248
-
249
-
250
-
251
-
252
-
253
-
254
-
255
-
256
-
257
-
258
-
259
-
260
-
261
-
262
-
263
-
264
-
265
-
266
-
267
-
268
-
269
-
270
-
271
-
272
-
273
-
274
-
275
-
276
-
277
-
278
-
279
-
280
-
281
-
282
-
283
-
284
-
285
-
286
-
287
-
288
-
289
-
290
-
291
-
292
-
293
-
294
-
295
-
296
-
297
-
298
-
299
-
300
-
301
-
302
-
303
-
304
-
305
-
306
-
307
-
308
-
309
-
310
-
311
-
312
-
313
-
314
-
315
-
316
-
317
-
318
-
319
-
320
-
321
-
322
-
323
-
324
 |
 |

181
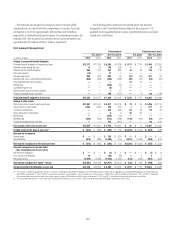
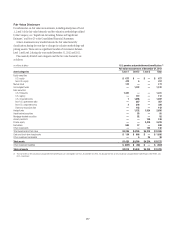
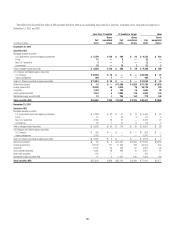
In millions of dollars Non-U.S. pension and postretirement benefit plans
Asset categories
Beginning Level 3
fair value at
Dec. 31, 2010
Realized
gains
(losses)
Unrealized
gains
(losses)
Purchases,
sales, and
issuances
Transfers in
and/or out of
Level 3
Ending Level 3
fair value at
Dec. 31, 2011
Equity securities
Non-U.S. equity $ 3 $— $ 2 $ — $ — $ 5
Mutual funds — — — — 32 32
Debt securities
Non-U.S. government bonds — — — — 5 5
Non-U.S. corporate bonds 107 — — 2 (105) 4
Hedge funds 14 (2) — — — 12
Other investments 189 4 — (10) 56 239
Total assets $ 313 $ 2 $ 2 $ (8) $ (12) $ 297
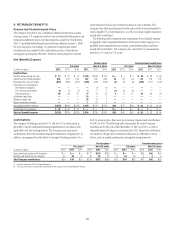
Investment Strategy
The Company’s global pension and postretirement funds’ investment
strategies are to invest in a prudent manner for the exclusive purpose of
providing benefits to participants. The investment strategies are targeted
to produce a total return that, when combined with the Company’s
contributions to the funds, will maintain the funds’ ability to meet all
required benefit obligations. Risk is controlled through diversification of asset
types and investments in domestic and international equities, fixed-income
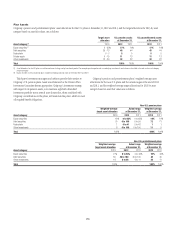
securities and cash and short-term investments. The target asset allocation
in most locations outside the U.S. is to have the majority of the assets in
equity and debt securities. These allocations may vary by geographic region
and country depending on the nature of applicable obligations and various
other regional considerations. The wide variation in the actual range of plan
asset allocations for the funded non-U.S. plans is a result of differing local
statutory requirements and economic conditions. For example, in certain
countries local law requires that all pension plan assets must be invested in
fixed-income investments, government funds, or local-country securities.
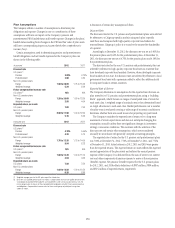
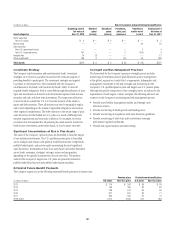
Significant Concentrations of Risk in Plan Assets
The assets of the Company’s pension plans are diversified to limit the impact
of any individual investment. The U.S. qualified pension plan is diversified
across multiple asset classes, with publicly traded fixed income, hedge funds,
publicly traded equity, and private equity representing the most significant
asset allocations. Investments in these four asset classes are further diversified
across funds, managers, strategies, vintages, sectors and geographies,
depending on the specific characteristics of each asset class. The pension
assets for the Company’s largest non-U.S. plans are primarily invested in
publicly traded fixed income and publicly traded equity securities.
Oversight and Risk Management Practices
The framework for the Company’s pensions oversight process includes
monitoring of retirement plans by plan fiduciaries and/or management
at the global, regional or country level, as appropriate. Independent risk
management contributes to the risk oversight and monitoring for the
Company’s U.S. qualified pension plan and largest non-U.S. pension plans.
Although the specific components of the oversight process are tailored to the
requirements of each region, country and plan, the following elements are
common to the Company’s monitoring and risk management process:
• Periodicasset/liabilitymanagementstudiesandstrategicasset
allocation reviews
• Periodicmonitoringoffundinglevelsandfundingratios
• Periodicmonitoringofcompliancewithassetallocationguidelines
• Periodicmonitoringofassetclassand/orinvestmentmanager
performance against benchmarks
• Periodicriskcapitalanalysisandstresstesting
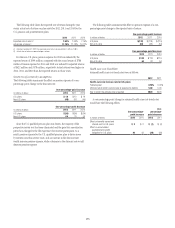
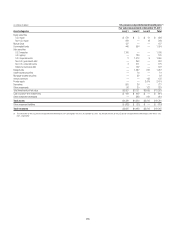
Estimated Future Benefit Payments
The Company expects to pay the following estimated benefit payments in future years:
Pension plans Postretirement benefit plans
In millions of dollars U.S. plans Non-U.S. plans U.S. plans Non-U.S. plans
2013 $ 774 $ 366 $ 88 $ 58
2014 796 356 86 63
2015 798 373 86 66
2016 811 391 83 71
2017 825 408 81 75
2018–2022 4,370 2,399 370 483