Citibank 2012 Annual Report Download - page 283
Download and view the complete annual report
Please find page 283 of the 2012 Citibank annual report below. You can navigate through the pages in the report by either clicking on the pages listed below, or by using the keyword search tool below to find specific information within the annual report.-
 1
1 -
2
-
3
-
4
-
5
-
6
-
7
-
8
-
9
-
10
-
11
-
12
-
13
-
14
-
15
-
16
-
17
-
18
-
19
-
20
-
21
-
22
-
23
-
24
-
25
-
26
-
27
-
28
-
29
-
30
-
31
-
32
-
33
-
34
-
35
-
36
-
37
-
38
-
39
-
40
-
41
-
42
-
43
-
44
-
45
-
46
-
47
-
48
-
49
-
50
-
51
-
52
-
53
-
54
-
55
-
56
-
57
-
58
-
59
-
60
-
61
-
62
-
63
-
64
-
65
-
66
-
67
-
68
-
69
-
70
-
71
-
72
-
73
-
74
-
75
-
76
-
77
-
78
-
79
-
80
-
81
-
82
-
83
-
84
-
85
-
86
-
87
-
88
-
89
-
90
-
91
-
92
-
93
-
94
-
95
-
96
-
97
-
98
-
99
-
100
-
101
-
102
-
103
-
104
-
105
-
106
-
107
-
108
-
109
-
110
-
111
-
112
-
113
-
114
-
115
-
116
-
117
-
118
-
119
-
120
-
121
-
122
-
123
-
124
-
125
-
126
-
127
-
128
-
129
-
130
-
131
-
132
-
133
-
134
-
135
-
136
-
137
-
138
-
139
-
140
-
141
-
142
-
143
-
144
-
145
-
146
-
147
-
148
-
149
-
150
-
151
-
152
-
153
-
154
-
155
-
156
-
157
-
158
-
159
-
160
-
161
-
162
-
163
-
164
-
165
-
166
-
167
-
168
-
169
-
170
-
171
-
172
-
173
-
174
-
175
-
176
-
177
-
178
-
179
-
180
-
181
-
182
-
183
-
184
-
185
-
186
-
187
-
188
-
189
-
190
-
191
-
192
-
193
-
194
-
195
-
196
-
197
-
198
-
199
-
200
-
201
-
202
-
203
-
204
-
205
-
206
-
207
-
208
-
209
-
210
-
211
-
212
-
213
-
214
-
215
-
216
-
217
-
218
-
219
-
220
-
221
-
222
-
223
-
224
-
225
-
226
-
227
-
228
-
229
-
230
-
231
-
232
-
233
-
234
-
235
-
236
-
237
-
238
-
239
-
240
-
241
-
242
-
243
-
244
-
245
-
246
-
247
-
248
-
249
-
250
-
251
-
252
-
253
-
254
-
255
-
256
-
257
-
258
-
259
-
260
-
261
-
262
-
263
-
264
-
265
-
266
-
267
-
268
-
269
-
270
-
271
-
272
-
 273
273 -
 274
274 -
 275
275 -
 276
276 -
 277
277 -
 278
278 -
 279
279 -
 280
280 -
 281
281 -
 282
282 -
 283
283 -
 284
284 -
 285
285 -
 286
286 -
 287
287 -
 288
288 -
 289
289 -
 290
290 -
 291
291 -
 292
292 -
 293
293 -
294
-
295
-
296
-
297
-
298
-
299
-
300
-
301
-
302
-
303
-
304
-
305
-
306
-
307
-
308
-
309
-
310
-
311
-
312
-
313
-
314
-
315
-
316
-
317
-
318
-
319
-
320
-
321
-
322
-
323
-
324
 |
 |

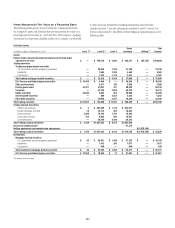
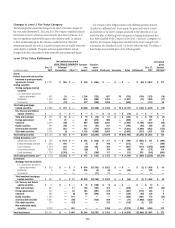
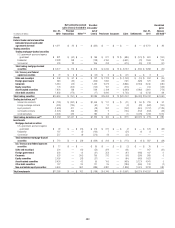
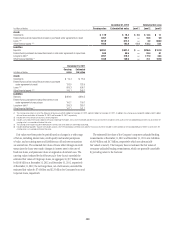
261
Net realized/unrealized
gains (losses) included in Transfers
into and/or
out of
Level 3
Dec. 31,
2011
Unrealized
gains
(losses)
still held
In millions of dollars
Dec. 31,
2010
Principal
transactions Other (1)(2) Purchases Issuances Sales Settlements (3)
Loans $3,213 $ — $ (309) $ 425 $ 250 $ 2,002 $ (85) $ (814) $ 4,682 $ (265)
Mortgage servicing rights 4,554 — (1,465) — — 408 (212) (716) 2,569 (1,465)
Other financial assets measured on a
recurring basis $ 2,509 $ — $ 109 $ (90) $ 57 $ 553 $ (172) $ (721) $ 2,245 $ 112
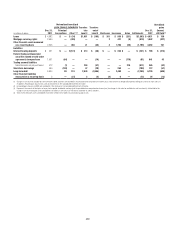
Liabilities
Interest-bearing deposits $ 277 $ — $ 86 $ (72) $ — $ 325 $ — $ (13) $ 431 $ (76)
Federal funds purchased and securities
loaned or sold under agreements
to repurchase 1,261 (22) — 45 — — (117) (150) 1,061 (64)
Trading account liabilities
Securities sold, not yet purchased 187 48 — 438 — — 413 (578) 412 42
Short-term borrowings 802 190 — (220) — 551 — (444) 499 39
Long-term debt 8,494 160 266 (509) — 1,485 — (2,140) 6,904 (225)
Other financial liabilities measured
on a recurring basis 19 — (19) 7 1 13 (1) (55) 3 (3)
(1) Changes in fair value for available-for-sale investments (debt securities) are recorded in Accumulated other comprehensive income (loss) unless other-than-temporarily impaired, while gains and losses from sales are
recorded in Realized gains (losses) from sales of investments on the Consolidated Statement of Income.
(2) Unrealized gains (losses) on MSRs are recorded in Other revenue on the Consolidated Statement of Income. See Note 15 to the Consolidated Financial Statements for a discussion of other-than-temporary impairment.
(3) Represents the amount of total gains or losses for the period, included in earnings (and Accumulated other comprehensive income (loss) for changes in fair value for available-for-sale investments), attributable to the
change in fair value relating to assets and liabilities classified as Level 3 that are still held at December 31, 2012 and 2011.
(4) Total Level 3 derivative assets and liabilities have been netted in these tables for presentation purposes only.
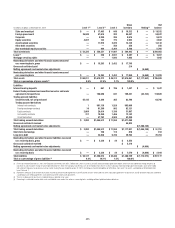
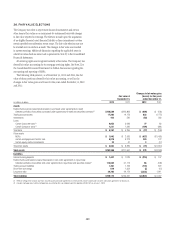
Level 3 Fair Value Rollforward
The following were the significant Level 3 transfers for the period
December 31, 2011 to December 31, 2012:
• Transfers of U.S. government-sponsored agency guaranteed mortgage-
backed securities in Trading account assets of $1.3 billion from Level 2
to Level 3 primarily due to a decrease in observability of prices.
• Transfers of other debt trading securities from Level 2 to Level 3 of
$1.1 billion, the majority of which consisted of trading loans for which
there were a reduced number of market quotations.
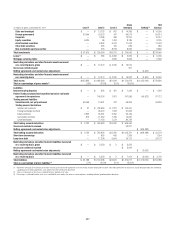
• Transfers of other debt trading securities from Level 3 to Level 2 of
$2.1 billion included $1.0 billion transferred to Level 2 primarily as a
result of an increased volume of market quotations, and a majority of
the remaining amount relates to positions that were reclassified as Level
3 positions within Loans to conform with the balance sheet presentation.
The reclassification has also been reflected as transfers into Level 3 within
loans in the roll-forward table above.
• Transfers of $3.7 billion of U.S. government-sponsored agency guaranteed
mortgage-backed securities in Investments from Level 3 to Level 2
consisting mainly of securities that were newly issued during the year. At
issuance, these securities had limited trading activity and were previously
classified as Level 3. As trading activity in these securities increased and
pricing became observable, these positions were transferred to Level 2.
• Transfers of Long-term debt in the amounts of $2.5 billion from Level 2
to Level 3 and $2.7 billion from Level 3 to Level 2 were the result of
Citi’s conforming and refining the application of the fair value level
classification methodologies to certain structured debt instruments
containing embedded derivatives, as well as certain underlying market
inputs becoming less or more observable.
In addition, 2012 included sales of non-marketable equity securities
classified as Investments of $2.8 billion relating to the sale of EMI Music and
EMI Music Publishing.
The following were the significant Level 3 transfers for the period
December 31, 2010 to December 31, 2011:
• Transfers of corporate debt trading securities of $1.5 billion from Level 2
to Level 3 due primarily to less price transparency for the securities.
• Transfers of Loans from Level 2 to Level 3 of $0.4 billion, due to a lack of
observable prices for certain loans.
In addition to the Level 3 transfers, the Level 3 roll-forward table above for
the period December 31, 2010 to December 31, 2011 included:
• The reclassification of $4.3 billion of securities from Investments held-
to-maturity to Trading account assets. These reclassifications have been
included in purchases in the Level 3 roll-forward table above. The Level 3
assets reclassified, and subsequently sold, included $2.8 billion of trading
mortgage-backed securities (of which $1.5 billion were Alt-A, $1.0 billion
were prime, $0.2 billion were subprime and $0.1 billion were commercial),
$0.9 billion of state and municipal debt securities, $0.3 billion of corporate
debt securities and $0.2 billion of asset-backed securities.
• Purchases of non-marketable equity securities classified as Investments
included approximately $2.8 billion relating to Citi’s acquisition of the
share capital of Maltby Acquisitions Limited, the holding company that
controls EMI Group Ltd. (which were sold in 2012).