Citibank 2012 Annual Report Download - page 290
Download and view the complete annual report
Please find page 290 of the 2012 Citibank annual report below. You can navigate through the pages in the report by either clicking on the pages listed below, or by using the keyword search tool below to find specific information within the annual report.-
 1
1 -
2
-
3
-
4
-
5
-
6
-
7
-
8
-
9
-
10
-
11
-
12
-
13
-
14
-
15
-
16
-
17
-
18
-
19
-
20
-
21
-
22
-
23
-
24
-
25
-
26
-
27
-
28
-
29
-
30
-
31
-
32
-
33
-
34
-
35
-
36
-
37
-
38
-
39
-
40
-
41
-
42
-
43
-
44
-
45
-
46
-
47
-
48
-
49
-
50
-
51
-
52
-
53
-
54
-
55
-
56
-
57
-
58
-
59
-
60
-
61
-
62
-
63
-
64
-
65
-
66
-
67
-
68
-
69
-
70
-
71
-
72
-
73
-
74
-
75
-
76
-
77
-
78
-
79
-
80
-
81
-
82
-
83
-
84
-
85
-
86
-
87
-
88
-
89
-
90
-
91
-
92
-
93
-
94
-
95
-
96
-
97
-
98
-
99
-
100
-
101
-
102
-
103
-
104
-
105
-
106
-
107
-
108
-
109
-
110
-
111
-
112
-
113
-
114
-
115
-
116
-
117
-
118
-
119
-
120
-
121
-
122
-
123
-
124
-
125
-
126
-
127
-
128
-
129
-
130
-
131
-
132
-
133
-
134
-
135
-
136
-
137
-
138
-
139
-
140
-
141
-
142
-
143
-
144
-
145
-
146
-
147
-
148
-
149
-
150
-
151
-
152
-
153
-
154
-
155
-
156
-
157
-
158
-
159
-
160
-
161
-
162
-
163
-
164
-
165
-
166
-
167
-
168
-
169
-
170
-
171
-
172
-
173
-
174
-
175
-
176
-
177
-
178
-
179
-
180
-
181
-
182
-
183
-
184
-
185
-
186
-
187
-
188
-
189
-
190
-
191
-
192
-
193
-
194
-
195
-
196
-
197
-
198
-
199
-
200
-
201
-
202
-
203
-
204
-
205
-
206
-
207
-
208
-
209
-
210
-
211
-
212
-
213
-
214
-
215
-
216
-
217
-
218
-
219
-
220
-
221
-
222
-
223
-
224
-
225
-
226
-
227
-
228
-
229
-
230
-
231
-
232
-
233
-
234
-
235
-
236
-
237
-
238
-
239
-
240
-
241
-
242
-
243
-
244
-
245
-
246
-
247
-
248
-
249
-
250
-
251
-
252
-
253
-
254
-
255
-
256
-
257
-
258
-
259
-
260
-
261
-
262
-
263
-
264
-
265
-
266
-
267
-
268
-
269
-
270
-
271
-
272
-
273
-
274
-
275
-
276
-
277
-
278
-
279
-
 280
280 -
 281
281 -
 282
282 -
 283
283 -
 284
284 -
 285
285 -
 286
286 -
 287
287 -
 288
288 -
 289
289 -
 290
290 -
 291
291 -
 292
292 -
 293
293 -
 294
294 -
 295
295 -
 296
296 -
 297
297 -
 298
298 -
 299
299 -
 300
300 -
301
-
302
-
303
-
304
-
305
-
306
-
307
-
308
-
309
-
310
-
311
-
312
-
313
-
314
-
315
-
316
-
317
-
318
-
319
-
320
-
321
-
322
-
323
-
324
 |
 |

268
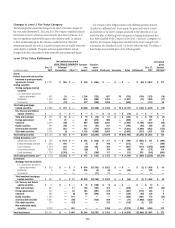
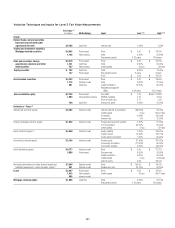
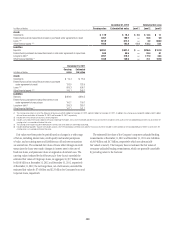
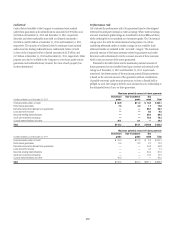
December 31, 2012 Estimated fair value
In billions of dollars Carrying value Estimated fair value Level 1 Level 2 Level 3
Assets
Investments $ 17.9 $ 18.4 $ 3.0 $ 14.3 $ 1.1
Federal funds sold and securities borrowed or purchased under agreements to resell 100.7 100.7 — 94.8 5.9
Loans (1)(2) 621.9 612.2 — 4.2 608.0
Other financial assets (2)(3) 192.8 192.8 11.4 128.3 53.1
Liabilities
Deposits $929.1 $ 927.4 $ — $765.5 $ 161.9
Federal funds purchased and securities loaned or sold under agreements to repurchase 94.5 94.5 — 94.4 0.1
Long-term debt (4) 209.7 215.3 — 177.0 38.3
Other financial liabilities (5) 139.0 139.0 — 31.1 107.9
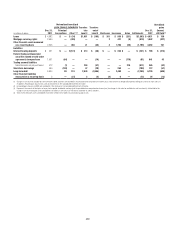
December 31, 2011
In billions of dollars
Carrying
value
Estimated
fair value
Assets
Investments $ 19.4 $ 18.4
Federal funds sold and securities borrowed or purchased
under agreements to resell 133.0 133.0
Loans (1)(2) 609.3 598.7
Other financial assets (2)(3) 245.7 245.7
Liabilities
Deposits $ 864.6 $ 864.5
Federal funds purchased and securities loaned or sold
under agreements to repurchase 100.7 100.7
Long-term debt (4) 299.3 289.7
Other financial liabilities (5) 141.1 141.1
(1) The carrying value of loans is net of the Allowance for loan losses of $25.5 billion for December 31, 2012 and $30.1 billion for December 31, 2011. In addition, the carrying values exclude $2.8 billion and $2.5 billion
of lease finance receivables at December 31, 2012 and December 31, 2011, respectively.
(2) Includes items measured at fair value on a nonrecurring basis.
(3) Includes cash and due from banks, deposits with banks, brokerage receivables, reinsurance recoverable and other financial instruments included in Other assets on the Consolidated Balance Sheet, for all of which the
carrying value is a reasonable estimate of fair value.
(4) The carrying value includes long-term debt balances carried at fair value under fair value hedge accounting.
(5) Includes brokerage payables, separate and variable accounts, short-term borrowings (carried at cost) and other financial instruments included in Other liabilities on the Consolidated Balance Sheet, for all of which the
carrying value is a reasonable estimate of fair value.
Fair values vary from period to period based on changes in a wide range
of factors, including interest rates, credit quality and market perceptions
of value, and as existing assets and liabilities run off and new transactions
are entered into. The estimated fair values of loans reflect changes in credit
status since the loans were made, changes in interest rates in the case of
fixed-rate loans, and premium values at origination of certain loans. The
carrying values (reduced by the Allowance for loan losses) exceeded the
estimated fair values of Citigroup’s loans, in aggregate, by $9.7 billion and
by $10.6 billion at December 31, 2012 and December 31, 2011, respectively.
At December 31, 2012, the carrying values, net of allowances, exceeded the
estimated fair values by $7.4 billion and $2.3 billion for Consumer loans and
Corporate loans, respectively.
The estimated fair values of the Company’s corporate unfunded lending
commitments at December 31, 2012 and December 31, 2011 were liabilities
of $4.9 billion and $4.7 billion, respectively, which are substantially
fair valued at Level 3. The Company does not estimate the fair values of
consumer unfunded lending commitments, which are generally cancelable
by providing notice to the borrower.