Citibank 2012 Annual Report Download - page 199
Download and view the complete annual report
Please find page 199 of the 2012 Citibank annual report below. You can navigate through the pages in the report by either clicking on the pages listed below, or by using the keyword search tool below to find specific information within the annual report.-
 1
1 -
2
-
3
-
4
-
5
-
6
-
7
-
8
-
9
-
10
-
11
-
12
-
13
-
14
-
15
-
16
-
17
-
18
-
19
-
20
-
21
-
22
-
23
-
24
-
25
-
26
-
27
-
28
-
29
-
30
-
31
-
32
-
33
-
34
-
35
-
36
-
37
-
38
-
39
-
40
-
41
-
42
-
43
-
44
-
45
-
46
-
47
-
48
-
49
-
50
-
51
-
52
-
53
-
54
-
55
-
56
-
57
-
58
-
59
-
60
-
61
-
62
-
63
-
64
-
65
-
66
-
67
-
68
-
69
-
70
-
71
-
72
-
73
-
74
-
75
-
76
-
77
-
78
-
79
-
80
-
81
-
82
-
83
-
84
-
85
-
86
-
87
-
88
-
89
-
90
-
91
-
92
-
93
-
94
-
95
-
96
-
97
-
98
-
99
-
100
-
101
-
102
-
103
-
104
-
105
-
106
-
107
-
108
-
109
-
110
-
111
-
112
-
113
-
114
-
115
-
116
-
117
-
118
-
119
-
120
-
121
-
122
-
123
-
124
-
125
-
126
-
127
-
128
-
129
-
130
-
131
-
132
-
133
-
134
-
135
-
136
-
137
-
138
-
139
-
140
-
141
-
142
-
143
-
144
-
145
-
146
-
147
-
148
-
149
-
150
-
151
-
152
-
153
-
154
-
155
-
156
-
157
-
158
-
159
-
160
-
161
-
162
-
163
-
164
-
165
-
166
-
167
-
168
-
169
-
170
-
171
-
172
-
173
-
174
-
175
-
176
-
177
-
178
-
179
-
180
-
181
-
182
-
183
-
184
-
185
-
186
-
187
-
188
-
 189
189 -
 190
190 -
 191
191 -
 192
192 -
 193
193 -
 194
194 -
 195
195 -
 196
196 -
 197
197 -
 198
198 -
 199
199 -
 200
200 -
 201
201 -
 202
202 -
 203
203 -
 204
204 -
 205
205 -
 206
206 -
 207
207 -
 208
208 -
 209
209 -
210
-
211
-
212
-
213
-
214
-
215
-
216
-
217
-
218
-
219
-
220
-
221
-
222
-
223
-
224
-
225
-
226
-
227
-
228
-
229
-
230
-
231
-
232
-
233
-
234
-
235
-
236
-
237
-
238
-
239
-
240
-
241
-
242
-
243
-
244
-
245
-
246
-
247
-
248
-
249
-
250
-
251
-
252
-
253
-
254
-
255
-
256
-
257
-
258
-
259
-
260
-
261
-
262
-
263
-
264
-
265
-
266
-
267
-
268
-
269
-
270
-
271
-
272
-
273
-
274
-
275
-
276
-
277
-
278
-
279
-
280
-
281
-
282
-
283
-
284
-
285
-
286
-
287
-
288
-
289
-
290
-
291
-
292
-
293
-
294
-
295
-
296
-
297
-
298
-
299
-
300
-
301
-
302
-
303
-
304
-
305
-
306
-
307
-
308
-
309
-
310
-
311
-
312
-
313
-
314
-
315
-
316
-
317
-
318
-
319
-
320
-
321
-
322
-
323
-
324
 |
 |

177
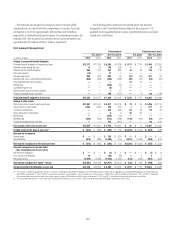
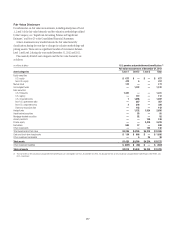
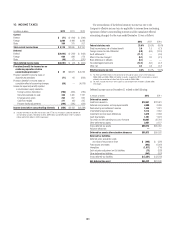
Fair Value Disclosure
For information on fair value measurements, including descriptions of Level
1, 2 and 3 of the fair value hierarchy and the valuation methodology utilized
by the Company, see “Significant Accounting Policies and Significant
Estimates” and Note 25 to the Consolidated Financial Statements.
Certain investments may transfer between the fair value hierarchy
classifications during the year due to changes in valuation methodology and
pricing sources. There were no significant transfers of investments between
Level 1 and Level 2 during the years ended December 31, 2012 and 2011.
Plan assets by detailed asset categories and the fair value hierarchy are
as follows:
In millions of dollars U.S. pension and postretirement benefit plans (1)
Fair value measurement at December 31, 2012
Asset categories Level 1 Level 2 Level 3 Total
Equity securities
U.S. equity $ 677 $ — $ — $ 677
Non-U.S. equity 412 5 — 417
Mutual funds 177 — — 177
Commingled funds — 1,132 — 1,132
Debt securities
U.S. Treasuries 1,431 — — 1,431
U.S. agency — 112 — 112
U.S. corporate bonds 1 1,396 — 1,397
Non-U.S. government debt — 387 — 387
Non-U.S. corporate bonds 4 346 — 350
State and municipal debt — 142 — 142
Hedge funds — 1,132 1,524 2,656
Asset-backed securities — 55 — 55
Mortgage-backed securities — 52 — 52
Annuity contracts — — 130 130
Private equity — — 2,419 2,419
Derivatives 593 37 — 630
Other investments — — 142 142
Total investments at fair value $3,295 $4,796 $4,215 $12,306
Cash and short-term investments $ 130 $ 906 $ — $ 1,036
Other investment receivables — 6 24 30
Total assets $3,425 $5,708 $4,239 $13,372
Other investment liabilities $ (607) $ (60) $ — $ (667)
Total net assets $2,818 $5,648 $4,239 $12,705
(1) The investments of the U.S. pension and postretirement benefit plans are commingled in one trust. At December 31, 2012, the allocable interests of the U.S. pension and postretirement benefit plans were 99.6% and
0.4%, respectively.