Citibank 2012 Annual Report Download - page 196
Download and view the complete annual report
Please find page 196 of the 2012 Citibank annual report below. You can navigate through the pages in the report by either clicking on the pages listed below, or by using the keyword search tool below to find specific information within the annual report.-
 1
1 -
2
-
3
-
4
-
5
-
6
-
7
-
8
-
9
-
10
-
11
-
12
-
13
-
14
-
15
-
16
-
17
-
18
-
19
-
20
-
21
-
22
-
23
-
24
-
25
-
26
-
27
-
28
-
29
-
30
-
31
-
32
-
33
-
34
-
35
-
36
-
37
-
38
-
39
-
40
-
41
-
42
-
43
-
44
-
45
-
46
-
47
-
48
-
49
-
50
-
51
-
52
-
53
-
54
-
55
-
56
-
57
-
58
-
59
-
60
-
61
-
62
-
63
-
64
-
65
-
66
-
67
-
68
-
69
-
70
-
71
-
72
-
73
-
74
-
75
-
76
-
77
-
78
-
79
-
80
-
81
-
82
-
83
-
84
-
85
-
86
-
87
-
88
-
89
-
90
-
91
-
92
-
93
-
94
-
95
-
96
-
97
-
98
-
99
-
100
-
101
-
102
-
103
-
104
-
105
-
106
-
107
-
108
-
109
-
110
-
111
-
112
-
113
-
114
-
115
-
116
-
117
-
118
-
119
-
120
-
121
-
122
-
123
-
124
-
125
-
126
-
127
-
128
-
129
-
130
-
131
-
132
-
133
-
134
-
135
-
136
-
137
-
138
-
139
-
140
-
141
-
142
-
143
-
144
-
145
-
146
-
147
-
148
-
149
-
150
-
151
-
152
-
153
-
154
-
155
-
156
-
157
-
158
-
159
-
160
-
161
-
162
-
163
-
164
-
165
-
166
-
167
-
168
-
169
-
170
-
171
-
172
-
173
-
174
-
175
-
176
-
177
-
178
-
179
-
180
-
181
-
182
-
183
-
184
-
185
-
 186
186 -
 187
187 -
 188
188 -
 189
189 -
 190
190 -
 191
191 -
 192
192 -
 193
193 -
 194
194 -
 195
195 -
 196
196 -
 197
197 -
 198
198 -
 199
199 -
 200
200 -
 201
201 -
 202
202 -
 203
203 -
 204
204 -
 205
205 -
 206
206 -
207
-
208
-
209
-
210
-
211
-
212
-
213
-
214
-
215
-
216
-
217
-
218
-
219
-
220
-
221
-
222
-
223
-
224
-
225
-
226
-
227
-
228
-
229
-
230
-
231
-
232
-
233
-
234
-
235
-
236
-
237
-
238
-
239
-
240
-
241
-
242
-
243
-
244
-
245
-
246
-
247
-
248
-
249
-
250
-
251
-
252
-
253
-
254
-
255
-
256
-
257
-
258
-
259
-
260
-
261
-
262
-
263
-
264
-
265
-
266
-
267
-
268
-
269
-
270
-
271
-
272
-
273
-
274
-
275
-
276
-
277
-
278
-
279
-
280
-
281
-
282
-
283
-
284
-
285
-
286
-
287
-
288
-
289
-
290
-
291
-
292
-
293
-
294
-
295
-
296
-
297
-
298
-
299
-
300
-
301
-
302
-
303
-
304
-
305
-
306
-
307
-
308
-
309
-
310
-
311
-
312
-
313
-
314
-
315
-
316
-
317
-
318
-
319
-
320
-
321
-
322
-
323
-
324
 |
 |

174
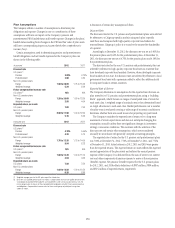
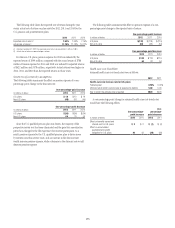
Plan Assumptions
The Company utilizes a number of assumptions to determine plan
obligations and expense. Changes in one or a combination of these
assumptions will have an impact on the Company’s pension and
postretirement PBO, funded status and benefit expense. Changes in the plans’
funded status resulting from changes in the PBO and fair value of plan assets
will have a corresponding impact on Accumulated other comprehensive
income (loss).
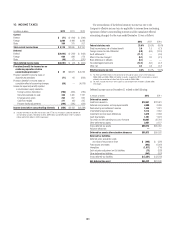
Certain assumptions used in determining pension and postretirement
benefit obligations and net benefit expenses for the Company’s plans are
shown in the following table:
At year end 2012 2011
Discount rate
U.S. plans (1)
Pension 3.90% 4.70%
Postretirement 3.60 4.30
Non-U.S. pension plans
Range 1.50 to 28.00 1.75 to 13.25
Weighted average 5.24 5.94
Future compensation increase rate
U.S. plans (2) N/A N/A
Non-U.S. pension plans
Range 1.20 to 26.00 1.60 to 13.30
Weighted average 3.93 4.04
Expected return on assets
U.S. plans 7.00 7.50
Non-U.S. pension plans
Range 0.90 to 11.50 1.00 to 12.50
Weighted average 5.76 6.25
During the year 2012 2011
Discount rate
U.S. plans (1)
Pension 4.70% 5.45%
Postretirement 4.30 5.10
Non-U.S. pension plans
Range 1.75 to 13.25 1.75 to 14.00
Weighted average 5.94 6.23
Future compensation increase rate
U.S. plans (2) N/A N/A
Non-U.S. pension plans
Range 1.60 to 13.30 1.00 to 11.00
Weighted average 4.04 4.66
Expected return on assets
U.S. plans 7.50 7.50
Non-U.S. pension plans
Range 1.00 to 12.50 1.00 to 12.50
Weighted average 6.25 6.89
(1) Weighted-average rates for the U.S. plans equal the stated rates.
(2) Since the U.S. qualified pension plan was frozen, a compensation increase rate applies only to certain
small groups of grandfathered employees accruing benefits under a final pay plan formula. Only the
future compensation increases for these grandfathered employees will affect future pension expense
and obligations. Compensation increase rates for these small groups of participants range from
3.00% to 4.00%.
A discussion of certain key assumptions follows.
Discount Rate
The discount rates for the U.S. pension and postretirement plans were selected
by reference to a Citigroup-specific analysis using each plan’s specific
cash flows and compared with high-quality corporate bond indices for
reasonableness. Citigroup’s policy is to round to the nearest five hundredths
of a percent.
Accordingly, at December 31, 2012, the discount rate was set at 3.90% for
the pension plans and 3.60% for the postretirement plans. At December 31,
2011, the discount rate was set at 4.70% for the pension plans and 4.30% for
the postretirement plans.
The discount rates for the non-U.S. pension and postretirement plans are
selected by reference to high-quality corporate bond rates in countries that
have developed corporate bond markets. However, where developed corporate
bond markets do not exist, the discount rates are selected by reference to local
government bond rates with a premium added to reflect the additional risk
for corporate bonds in certain countries.
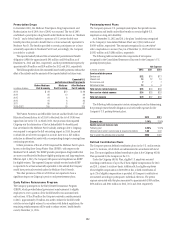
Expected Rate of Return
The Company determines its assumptions for the expected rate of return on
plan assets for its U.S. pension and postretirement plans using a “building
block” approach, which focuses on ranges of anticipated rates of return for
each asset class. A weighted range of nominal rates is then determined based
on target allocations to each asset class. Market performance over a number
of earlier years is evaluated covering a wide range of economic conditions to
determine whether there are sound reasons for projecting any past trends.
The Company considers the expected rate of return to be a long-term
assessment of return expectations and does not anticipate changing this
assumption annually unless there are significant changes in investment
strategy or economic conditions. This contrasts with the selection of the
discount rate and certain other assumptions, which are reconsidered
annually in accordance with generally accepted accounting principles.
The expected rate of return for the U.S. pension and postretirement plans
was 7.00% at December 31, 2012, 7.50% at December 31, 2011, and 7.50%
at December 31, 2010. Actual returns in 2012, 2011 and 2010 were greater
than the expected returns. The expected return on assets reflects the expected
annual appreciation of the plan assets and reduces the annual pension
expense of the Company. It is deducted from the sum of service cost, interest
cost and other components of pension expense to arrive at the net pension
(benefit) expense. Net pension (benefit) expense for the U.S. pension plans
for 2012, 2011, and 2010 reflects deductions of $897 million, $890 million,
and $874 million of expected returns, respectively.