Citibank 2012 Annual Report Download - page 194
Download and view the complete annual report
Please find page 194 of the 2012 Citibank annual report below. You can navigate through the pages in the report by either clicking on the pages listed below, or by using the keyword search tool below to find specific information within the annual report.-
 1
1 -
2
-
3
-
4
-
5
-
6
-
7
-
8
-
9
-
10
-
11
-
12
-
13
-
14
-
15
-
16
-
17
-
18
-
19
-
20
-
21
-
22
-
23
-
24
-
25
-
26
-
27
-
28
-
29
-
30
-
31
-
32
-
33
-
34
-
35
-
36
-
37
-
38
-
39
-
40
-
41
-
42
-
43
-
44
-
45
-
46
-
47
-
48
-
49
-
50
-
51
-
52
-
53
-
54
-
55
-
56
-
57
-
58
-
59
-
60
-
61
-
62
-
63
-
64
-
65
-
66
-
67
-
68
-
69
-
70
-
71
-
72
-
73
-
74
-
75
-
76
-
77
-
78
-
79
-
80
-
81
-
82
-
83
-
84
-
85
-
86
-
87
-
88
-
89
-
90
-
91
-
92
-
93
-
94
-
95
-
96
-
97
-
98
-
99
-
100
-
101
-
102
-
103
-
104
-
105
-
106
-
107
-
108
-
109
-
110
-
111
-
112
-
113
-
114
-
115
-
116
-
117
-
118
-
119
-
120
-
121
-
122
-
123
-
124
-
125
-
126
-
127
-
128
-
129
-
130
-
131
-
132
-
133
-
134
-
135
-
136
-
137
-
138
-
139
-
140
-
141
-
142
-
143
-
144
-
145
-
146
-
147
-
148
-
149
-
150
-
151
-
152
-
153
-
154
-
155
-
156
-
157
-
158
-
159
-
160
-
161
-
162
-
163
-
164
-
165
-
166
-
167
-
168
-
169
-
170
-
171
-
172
-
173
-
174
-
175
-
176
-
177
-
178
-
179
-
180
-
181
-
182
-
183
-
 184
184 -
 185
185 -
 186
186 -
 187
187 -
 188
188 -
 189
189 -
 190
190 -
 191
191 -
 192
192 -
 193
193 -
 194
194 -
 195
195 -
 196
196 -
 197
197 -
 198
198 -
 199
199 -
 200
200 -
 201
201 -
 202
202 -
 203
203 -
 204
204 -
205
-
206
-
207
-
208
-
209
-
210
-
211
-
212
-
213
-
214
-
215
-
216
-
217
-
218
-
219
-
220
-
221
-
222
-
223
-
224
-
225
-
226
-
227
-
228
-
229
-
230
-
231
-
232
-
233
-
234
-
235
-
236
-
237
-
238
-
239
-
240
-
241
-
242
-
243
-
244
-
245
-
246
-
247
-
248
-
249
-
250
-
251
-
252
-
253
-
254
-
255
-
256
-
257
-
258
-
259
-
260
-
261
-
262
-
263
-
264
-
265
-
266
-
267
-
268
-
269
-
270
-
271
-
272
-
273
-
274
-
275
-
276
-
277
-
278
-
279
-
280
-
281
-
282
-
283
-
284
-
285
-
286
-
287
-
288
-
289
-
290
-
291
-
292
-
293
-
294
-
295
-
296
-
297
-
298
-
299
-
300
-
301
-
302
-
303
-
304
-
305
-
306
-
307
-
308
-
309
-
310
-
311
-
312
-
313
-
314
-
315
-
316
-
317
-
318
-
319
-
320
-
321
-
322
-
323
-
324
 |
 |

172
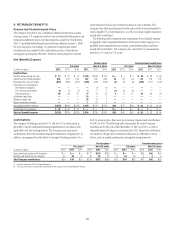
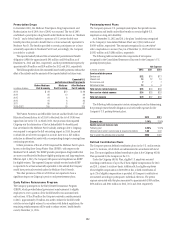
The estimated net actuarial loss and prior service cost that will be
amortized from Accumulated other comprehensive income (loss) into
net expense in 2013 are approximately $226 million and $3 million,
respectively, for defined benefit pension plans. For postretirement plans, the
estimated 2013 net actuarial loss and prior service cost amortizations are
approximately $45 million and $(1) million, respectively.
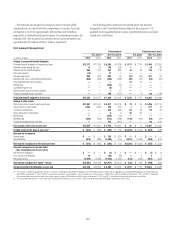
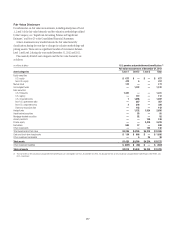
The following table summarizes the funded status and amounts
recognized in the Consolidated Balance Sheet for the Company’s U.S.
qualified and nonqualified pension plans, postretirement plans and plans
outside the United States.
Net Amount Recognized
Pension plans Postretirement plans
U.S. plans (1) Non-U.S. plans U.S. plans Non-U.S. plans
In millions of dollars 2012 2011 2012 2011 2012 2011 2012 2011
Change in projected benefit obligation
Projected benefit obligation at beginning of year $12,377 $11,730 $ 6,262 $ 6,189 $ 1,127 $ 1,179 $1,368 $ 1,395
Benefits earned during the year 12 13 199 203 ——29 28
Interest cost on benefit obligation 565 612 367 382 44 53 116 118
Plan amendments (13) —17 2————
Actuarial (gain) loss 965 655 923 59 (24) (44) 457 29
Benefits paid, net of participating contributions (638) (633) (306) (282) (85) (79) (54) (54)
Expected Medicare Part D subsidy ————10 10 ——
Settlements ——(254) (44) ————
Curtailment (gain) loss ——(8) 3————
Special/contractual termination benefits ——127 ————
Foreign exchange impact and other ——198 (277) —886 (148)
Projected benefit obligation at year end $13,268 $12,377 $ 7,399 $ 6,262 $ 1,072 $ 1,127 $2,002 $ 1,368
Change in plan assets
Plan assets at fair value at beginning of year $11,991 $11,561 $ 6,421 $ 6,145 $ 74 $ 95 $ 1,096 $ 1,176
Actual return on plan assets 1,303 1,063 786 526 75277 40
Company contributions ——352 389 54 53 92 75
Plan participants contributions ——6658 65 ——
Settlements ——(254) (44) ————
Benefits paid (638) (633) (312) (288) (143) (144) (54) (54)
Foreign exchange impact and other ——155 (313) ——86 (141)
Plan assets at fair value at year end $12,656 $11,991 $ 7,154 $ 6,421 $ 50 $ 74 $ 1,497 $ 1,096
Funded status of the plan at year end (2) $ (612) $ (386) $ (245) $ 159 $(1,022) $(1,053) $ (505) (272)
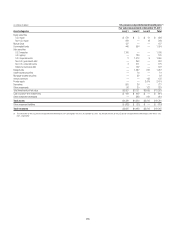
Net amount recognized
Benefit asset $ — $ — $ 763 $ 874 $ — $ — $ — $ —
Benefit liability (612) (386) (1,008) (715) (1,022) (1,053) (505) (272)
Net amount recognized on the balance sheet $ (612) $ (386) $ (245) $ 159 $(1,022) $(1,053) $ (505) $ (272)
Amounts recognized in Accumulated
other comprehensive income (loss)
Net transition obligation $ — $ — $ (2) $ 1 $ — $ — $ (1) $ (1)
Prior service cost (benefit) 13 1(33) (23) 1355
Net actuarial loss (4,904) (4,440) (1,936) (1,454) (123) (152) (802) (509)
Net amount recognized in equity—pretax $ (4,891) $ (4,439) $(1,971) $(1,476) $ (122) $ (149) $ (798) (505)
Accumulated benefit obligation at year end $13,246 $12,337 $ 6,369 $ 5,463 $ 1,072 $ 1,127 $ 2,002 $ 1,368
(1) The U.S. plans exclude nonqualified pension plans, for which the aggregate projected benefit obligation was $769 million and $713 million and the aggregate accumulated benefit obligation was $738 million and
$694 million at December 31, 2012 and 2011, respectively. These plans are unfunded. As such, the funded status of these plans is $(769) million and $(713) million at December 31, 2012 and 2011, respectively.
Accumulated other comprehensive income (loss) reflects pretax charges of $298 million and $231 million at December 31, 2012 and 2011, respectively, that primarily relate to net actuarial loss.
(2) The U.S. qualified pension plan is fully funded under specified ERISA funding rules as of January 1, 2013 and no minimum required funding is expected for 2012 or 2013.