Citibank 2012 Annual Report Download - page 66
Download and view the complete annual report
Please find page 66 of the 2012 Citibank annual report below. You can navigate through the pages in the report by either clicking on the pages listed below, or by using the keyword search tool below to find specific information within the annual report.-
 1
1 -
2
-
3
-
4
-
5
-
6
-
7
-
8
-
9
-
10
-
11
-
12
-
13
-
14
-
15
-
16
-
17
-
18
-
19
-
20
-
21
-
22
-
23
-
24
-
25
-
26
-
27
-
28
-
29
-
30
-
31
-
32
-
33
-
34
-
35
-
36
-
37
-
38
-
39
-
40
-
41
-
42
-
43
-
44
-
45
-
46
-
47
-
48
-
49
-
50
-
51
-
52
-
53
-
54
-
55
-
 56
56 -
 57
57 -
 58
58 -
 59
59 -
 60
60 -
 61
61 -
 62
62 -
 63
63 -
 64
64 -
 65
65 -
 66
66 -
 67
67 -
 68
68 -
 69
69 -
 70
70 -
 71
71 -
 72
72 -
 73
73 -
 74
74 -
 75
75 -
 76
76 -
77
-
78
-
79
-
80
-
81
-
82
-
83
-
84
-
85
-
86
-
87
-
88
-
89
-
90
-
91
-
92
-
93
-
94
-
95
-
96
-
97
-
98
-
99
-
100
-
101
-
102
-
103
-
104
-
105
-
106
-
107
-
108
-
109
-
110
-
111
-
112
-
113
-
114
-
115
-
116
-
117
-
118
-
119
-
120
-
121
-
122
-
123
-
124
-
125
-
126
-
127
-
128
-
129
-
130
-
131
-
132
-
133
-
134
-
135
-
136
-
137
-
138
-
139
-
140
-
141
-
142
-
143
-
144
-
145
-
146
-
147
-
148
-
149
-
150
-
151
-
152
-
153
-
154
-
155
-
156
-
157
-
158
-
159
-
160
-
161
-
162
-
163
-
164
-
165
-
166
-
167
-
168
-
169
-
170
-
171
-
172
-
173
-
174
-
175
-
176
-
177
-
178
-
179
-
180
-
181
-
182
-
183
-
184
-
185
-
186
-
187
-
188
-
189
-
190
-
191
-
192
-
193
-
194
-
195
-
196
-
197
-
198
-
199
-
200
-
201
-
202
-
203
-
204
-
205
-
206
-
207
-
208
-
209
-
210
-
211
-
212
-
213
-
214
-
215
-
216
-
217
-
218
-
219
-
220
-
221
-
222
-
223
-
224
-
225
-
226
-
227
-
228
-
229
-
230
-
231
-
232
-
233
-
234
-
235
-
236
-
237
-
238
-
239
-
240
-
241
-
242
-
243
-
244
-
245
-
246
-
247
-
248
-
249
-
250
-
251
-
252
-
253
-
254
-
255
-
256
-
257
-
258
-
259
-
260
-
261
-
262
-
263
-
264
-
265
-
266
-
267
-
268
-
269
-
270
-
271
-
272
-
273
-
274
-
275
-
276
-
277
-
278
-
279
-
280
-
281
-
282
-
283
-
284
-
285
-
286
-
287
-
288
-
289
-
290
-
291
-
292
-
293
-
294
-
295
-
296
-
297
-
298
-
299
-
300
-
301
-
302
-
303
-
304
-
305
-
306
-
307
-
308
-
309
-
310
-
311
-
312
-
313
-
314
-
315
-
316
-
317
-
318
-
319
-
320
-
321
-
322
-
323
-
324
 |
 |

44
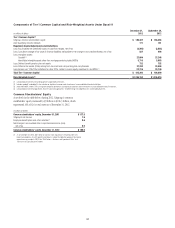
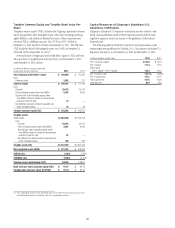
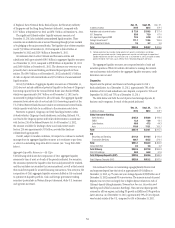
Components of Tier 1 Common Capital and Risk-Weighted Assets Under Basel III
In millions of dollars
December 31,
2012
September 30,
2012
Tier 1 Common Capital (1)
Citigroup common stockholders’ equity $ 186,487 $ 186,465
Add: Qualifying minority interests 171 161
Regulatory Capital Adjustments and Deductions:
Less: Accumulated net unrealized losses on cash flow hedges, net of tax (2,293) (2,503)
Less: Cumulative change in fair value of financial liabilities attributable to the change in own creditworthiness, net of tax 587 998
Less: Intangible assets:
Goodwill (2) 27,004 27,248
Identifiable intangible assets other than mortgage servicing rights (MSRs) 5,716 5,983
Less: Defined benefit pension plan net assets 732 752
Less: Deferred tax assets (DTAs) arising from tax credit and net operating loss carryforwards 27,200 23,500
Less: Excess over 10%/15% limitations for other DTAs, certain common equity investments, and MSRs (3) 22,316 23,749
Total Tier 1 Common Capital $ 105,396 $ 106,899
Risk-Weighted Assets (4) $1,206,153 $1,236,619
(1) Calculated based on the U.S. banking agencies proposed Basel III rules.
(2) Includes goodwill “embedded” in the valuation of significant common stock investments in unconsolidated financial institutions.
(3) Aside from MSRs, reflects DTAs arising from temporary differences and significant common stock investments in unconsolidated financial institutions.
(4) Calculated based on the proposed U.S. Basel III “advanced approaches” for determining risk-weighted assets and including Basel II.5.
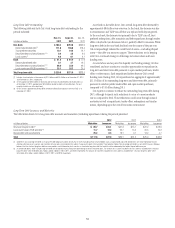
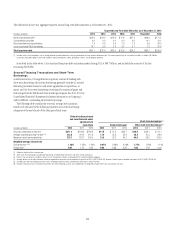
Common Stockholders’ Equity
As set forth in the table below, during 2012, Citigroup’s common
stockholders’ equity increased by $9 billion to $186.5 billion, which
represented 10% of Citi’s total assets as of December 31, 2012.
In billions of dollars
Common stockholders’ equity, December 31, 2011 $ 177.5
Citigroup’s net income 7.5
Employee benefit plans and other activities (1) 0.6
Net change in accumulated other comprehensive income (loss),
net of tax 0.9
Common stockholders’ equity, December 31, 2012 $ 186.5
(1) As of December 31, 2012, $6.7 billion of common stock repurchases remained under Citi’s
repurchase programs. Any Citi repurchase program is subject to regulatory approval. No material
repurchases were made in 2012. See “Risk Factors—Business and Operational Risks” and
“Purchases of Equity Securities” below.