Citibank 2012 Annual Report Download - page 59
Download and view the complete annual report
Please find page 59 of the 2012 Citibank annual report below. You can navigate through the pages in the report by either clicking on the pages listed below, or by using the keyword search tool below to find specific information within the annual report.-
 1
1 -
2
-
3
-
4
-
5
-
6
-
7
-
8
-
9
-
10
-
11
-
12
-
13
-
14
-
15
-
16
-
17
-
18
-
19
-
20
-
21
-
22
-
23
-
24
-
25
-
26
-
27
-
28
-
29
-
30
-
31
-
32
-
33
-
34
-
35
-
36
-
37
-
38
-
39
-
40
-
41
-
42
-
43
-
44
-
45
-
46
-
47
-
48
-
 49
49 -
 50
50 -
 51
51 -
 52
52 -
 53
53 -
 54
54 -
 55
55 -
 56
56 -
 57
57 -
 58
58 -
 59
59 -
 60
60 -
 61
61 -
 62
62 -
 63
63 -
 64
64 -
 65
65 -
 66
66 -
 67
67 -
 68
68 -
 69
69 -
70
-
71
-
72
-
73
-
74
-
75
-
76
-
77
-
78
-
79
-
80
-
81
-
82
-
83
-
84
-
85
-
86
-
87
-
88
-
89
-
90
-
91
-
92
-
93
-
94
-
95
-
96
-
97
-
98
-
99
-
100
-
101
-
102
-
103
-
104
-
105
-
106
-
107
-
108
-
109
-
110
-
111
-
112
-
113
-
114
-
115
-
116
-
117
-
118
-
119
-
120
-
121
-
122
-
123
-
124
-
125
-
126
-
127
-
128
-
129
-
130
-
131
-
132
-
133
-
134
-
135
-
136
-
137
-
138
-
139
-
140
-
141
-
142
-
143
-
144
-
145
-
146
-
147
-
148
-
149
-
150
-
151
-
152
-
153
-
154
-
155
-
156
-
157
-
158
-
159
-
160
-
161
-
162
-
163
-
164
-
165
-
166
-
167
-
168
-
169
-
170
-
171
-
172
-
173
-
174
-
175
-
176
-
177
-
178
-
179
-
180
-
181
-
182
-
183
-
184
-
185
-
186
-
187
-
188
-
189
-
190
-
191
-
192
-
193
-
194
-
195
-
196
-
197
-
198
-
199
-
200
-
201
-
202
-
203
-
204
-
205
-
206
-
207
-
208
-
209
-
210
-
211
-
212
-
213
-
214
-
215
-
216
-
217
-
218
-
219
-
220
-
221
-
222
-
223
-
224
-
225
-
226
-
227
-
228
-
229
-
230
-
231
-
232
-
233
-
234
-
235
-
236
-
237
-
238
-
239
-
240
-
241
-
242
-
243
-
244
-
245
-
246
-
247
-
248
-
249
-
250
-
251
-
252
-
253
-
254
-
255
-
256
-
257
-
258
-
259
-
260
-
261
-
262
-
263
-
264
-
265
-
266
-
267
-
268
-
269
-
270
-
271
-
272
-
273
-
274
-
275
-
276
-
277
-
278
-
279
-
280
-
281
-
282
-
283
-
284
-
285
-
286
-
287
-
288
-
289
-
290
-
291
-
292
-
293
-
294
-
295
-
296
-
297
-
298
-
299
-
300
-
301
-
302
-
303
-
304
-
305
-
306
-
307
-
308
-
309
-
310
-
311
-
312
-
313
-
314
-
315
-
316
-
317
-
318
-
319
-
320
-
321
-
322
-
323
-
324
 |
 |

37
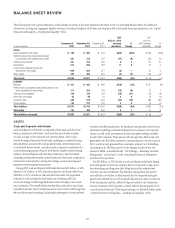
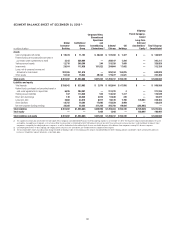
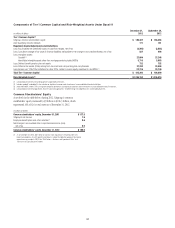
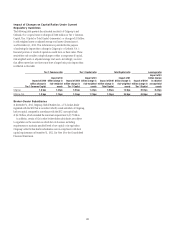
BALANCE SHEET REVIEW
The following sets forth a general discussion of the changes in certain of the more significant line items of Citi’s Consolidated Balance Sheet. For additional
information on Citigroup’s aggregate liquidity resources, including its deposits, short-term and long-term debt and secured financing transactions, see “Capital
Resources and Liquidity—Funding and Liquidity” below.
In billions of dollars
December 31,
2012
September 30,
2012
December 31,
2011
EOP
4Q12 vs. 3Q12
Increase
(decrease)
%
Change
EOP
4Q12 vs.
4Q11 Increase
(decrease)
%
Change
Assets
Cash and deposits with banks $ 139 $ 204 $ 184 $(65) (32)% $ (45)(24)%
Federal funds sold and securities borrowed
or purchased under agreements to resell 261 278 276 (17) (6) (15)(5)
Trading account assets 321 315 292 6 2 29 10
Investments 312 295 293 17 6 19 6
Loans, net of unearned income and
allowance for loan losses 630 633 617 (3) — 13 2
Other assets 202 206 212 (4) (2) (10)(5)
Total assets $ 1,865 $1,931 $1,874 $(66) (3)% $ (9)—%
Liabilities
Deposits $ 931 $ 945 $ 866 $(14) (1)% $ 65 8%
Federal funds purchased and securities loaned or sold
under agreements to repurchase 211 224 198 (13) (6) 13 7
Trading account liabilities 116 130 126 (14) (11) (10)(8)
Short-term borrowings 52 49 54 3 6 (2)(4)
Long-term debt 239 272 324 (33) (12) (85)(26)
Other liabilities 125 122 126 3 2 (1)(1)
Total liabilities $1,674 $1,742 $1,694 $(68) (4)% $ (20)(1)%
Total equity 191 189 180 2 1 11 6
Total liabilities and equity $1,865 $1,931 $1,874 $(66) (3)% $ (9)—%
ASSETS
Cash and Deposits with Banks
Cash and deposits with banks is composed of both Cash and due from
banks and Deposits with banks. Cash and due from banks includes
(i) cash on hand at Citi’s domestic and overseas offices, and (ii) non-
interest-bearing balances due from banks, including non-interest-bearing
demand deposit accounts with correspondent banks, central banks (such
as the Federal Reserve Bank), and other banks or depository institutions for
normal operating purposes. Deposits with banks includes interest-bearing
balances, demand deposits and time deposits held in or due from banks
(including correspondent banks, central banks and other banks or depository
institutions) maintained for, among other things, normal operating and
regulatory reserve requirement purposes.
During 2012, cash and deposits with banks decreased $45 billion, or 24%,
driven by a $53 billion, or 34%, decrease in deposits with banks offset by an
$8 billion, or 27%, increase in cash and due from banks. The purposeful
reduction in cash and deposits with banks was in keeping with Citi’s
continued strategy to deleverage the balance sheet and deploy excess cash
into investments. The overall decline resulted from cash used to repay long-
term debt maturities (net of modest issuances) and to reduce other long-term
debt and short-term borrowings (including the redemption of trust preferred
securities and debt repurchases), the funding of asset growth in the Citicorp
businesses (including continued lending to both Consumer and Corporate
clients), as well as the reinvestment of cash into higher yielding available-
for-sale (AFS) securities. These uses of cash were partially offset by the cash
generated by the $65 billion increase in customer deposits over the course of
2012, as well as cash generated from asset sales, primarily in Citi Holdings
(including the $1.89 billion paid to Citi by Morgan Stanley for the 14%
interest in MSSB, as described under “Citi Holdings—Brokerage and Asset
Management” and in Note 15 to the Consolidated Financial Statements),
and from Citi’s operations.
The $65 billion, or 32%, decline in cash and deposits with banks during
the fourth quarter of 2012 was similarly driven by cash used to repay short-
term borrowings and long-term debt obligations and the redeployment
of excess cash into investments. The reduction during the fourth quarter
also reflected a net decline in client deposits that was expected during the
quarter and reflected the run-off of episodic deposits that came in at the end
of the third quarter and the outflows of deposits related to the Transaction
Account Guarantee (TAG) program, partially offset by deposit growth in the
normal course of business. These deposit changes are discussed further under
“Capital Resources and Liquidity—Funding and Liquidity” below.