Citibank 2012 Annual Report Download - page 186
Download and view the complete annual report
Please find page 186 of the 2012 Citibank annual report below. You can navigate through the pages in the report by either clicking on the pages listed below, or by using the keyword search tool below to find specific information within the annual report.-
 1
1 -
2
-
3
-
4
-
5
-
6
-
7
-
8
-
9
-
10
-
11
-
12
-
13
-
14
-
15
-
16
-
17
-
18
-
19
-
20
-
21
-
22
-
23
-
24
-
25
-
26
-
27
-
28
-
29
-
30
-
31
-
32
-
33
-
34
-
35
-
36
-
37
-
38
-
39
-
40
-
41
-
42
-
43
-
44
-
45
-
46
-
47
-
48
-
49
-
50
-
51
-
52
-
53
-
54
-
55
-
56
-
57
-
58
-
59
-
60
-
61
-
62
-
63
-
64
-
65
-
66
-
67
-
68
-
69
-
70
-
71
-
72
-
73
-
74
-
75
-
76
-
77
-
78
-
79
-
80
-
81
-
82
-
83
-
84
-
85
-
86
-
87
-
88
-
89
-
90
-
91
-
92
-
93
-
94
-
95
-
96
-
97
-
98
-
99
-
100
-
101
-
102
-
103
-
104
-
105
-
106
-
107
-
108
-
109
-
110
-
111
-
112
-
113
-
114
-
115
-
116
-
117
-
118
-
119
-
120
-
121
-
122
-
123
-
124
-
125
-
126
-
127
-
128
-
129
-
130
-
131
-
132
-
133
-
134
-
135
-
136
-
137
-
138
-
139
-
140
-
141
-
142
-
143
-
144
-
145
-
146
-
147
-
148
-
149
-
150
-
151
-
152
-
153
-
154
-
155
-
156
-
157
-
158
-
159
-
160
-
161
-
162
-
163
-
164
-
165
-
166
-
167
-
168
-
169
-
170
-
171
-
172
-
173
-
174
-
175
-
 176
176 -
 177
177 -
 178
178 -
 179
179 -
 180
180 -
 181
181 -
 182
182 -
 183
183 -
 184
184 -
 185
185 -
 186
186 -
 187
187 -
 188
188 -
 189
189 -
 190
190 -
 191
191 -
 192
192 -
 193
193 -
 194
194 -
 195
195 -
 196
196 -
197
-
198
-
199
-
200
-
201
-
202
-
203
-
204
-
205
-
206
-
207
-
208
-
209
-
210
-
211
-
212
-
213
-
214
-
215
-
216
-
217
-
218
-
219
-
220
-
221
-
222
-
223
-
224
-
225
-
226
-
227
-
228
-
229
-
230
-
231
-
232
-
233
-
234
-
235
-
236
-
237
-
238
-
239
-
240
-
241
-
242
-
243
-
244
-
245
-
246
-
247
-
248
-
249
-
250
-
251
-
252
-
253
-
254
-
255
-
256
-
257
-
258
-
259
-
260
-
261
-
262
-
263
-
264
-
265
-
266
-
267
-
268
-
269
-
270
-
271
-
272
-
273
-
274
-
275
-
276
-
277
-
278
-
279
-
280
-
281
-
282
-
283
-
284
-
285
-
286
-
287
-
288
-
289
-
290
-
291
-
292
-
293
-
294
-
295
-
296
-
297
-
298
-
299
-
300
-
301
-
302
-
303
-
304
-
305
-
306
-
307
-
308
-
309
-
310
-
311
-
312
-
313
-
314
-
315
-
316
-
317
-
318
-
319
-
320
-
321
-
322
-
323
-
324
 |
 |

164
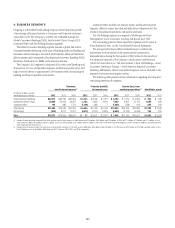
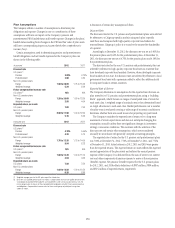
5. INTEREST REVENUE AND EXPENSE
For the years ended December 31, 2012, 2011 and 2010, respectively, Interest
revenue and Interest expense consisted of the following:
In millions of dollars 2012 2011 2010
Interest revenue
Loan interest, including fees $48,544 $50,281 $55,056
Deposits with banks 1,269 1,750 1,252
Federal funds sold and securities borrowed or
purchased under agreements to resell 3,418 3,631 3,156
Investments, including dividends 7,525 8,320 11,004
Trading account assets (1) 6,802 8,186 8,079
Other interest 580 513 735
Total interest revenue $68,138 $72,681 $79,282
Interest expense
Deposits (2) $ 7,613 $ 8,556 $ 8,371
Federal funds purchased and securities loaned or
sold under agreements to repurchase 2,817 3,197 2,808
Trading account liabilities (1) 190 408 379
Short-term borrowings 727 650 917
Long-term debt 9,188 11,423 12,621
Total interest expense $20,535 $24,234 $25,096
Net interest revenue $47,603 $48,447 $54,186
Provision for loan losses 10,848 11,773 25,194
Net interest revenue after
provision for loan losses $36,755 $36,674 $28,992
(1) Interest expense on Trading account liabilities of ICG is reported as a reduction of interest revenue
from Trading account assets.
(2) Includes deposit insurance fees and charges of $1,262 million, $1,332 million and $981 million for
the years ended December 31, 2012, December 31, 2011 and December 31, 2010, respectively.
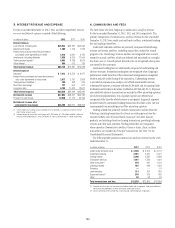
6. COMMISSIONS AND FEES
The table below sets forth Citigroup’s Commissions and fees revenue
for the years ended December 31, 2012, 2011 and 2010, respectively. The
primary components of Commissions and fees revenue for the year ended
December 31, 2012 were credit card and bank card fees, investment banking
fees and trading-related fees.
Credit card and bank card fees are primarily composed of interchange
revenue and certain card fees, including annual fees, reduced by reward
program costs. Interchange revenue and fees are recognized when earned,
except for annual card fees, which are deferred and amortized on a straight-
line basis over a 12-month period. Reward costs are recognized when points
are earned by the customers.
Investment banking fees are substantially composed of underwriting and
advisory revenues. Investment banking fees are recognized when Citigroup’s
performance under the terms of the contractual arrangements is completed,
which is typically at the closing of the transaction. Underwriting revenue
is recorded in Commissions and fees, net of both reimbursable and non-
reimbursable expenses, consistent with the AICPA Audit and Accounting Guide
for Brokers and Dealers in Securities (codified in ASC 940-605-05-1). Expenses
associated with advisory transactions are recorded in Other operating expenses,
net of client reimbursements. Out-of-pocket expenses are deferred and
recognized at the time the related revenue is recognized. In general, expenses
incurred related to investment banking transactions that fail to close (are not
consummated) are recorded gross in Other operating expenses.
Trading-related fees primarily include commissions and fees from the
following: executing transactions for clients on exchanges and over-the-
counter markets; sale of mutual funds, insurance and other annuity
products; and assisting clients in clearing transactions, providing brokerage
services and other such activities. Trading-related fees are recognized
when earned in Commissions and fees. Gains or losses, if any, on these
transactions are included in Principal transactions (see Note 7 to the
Consolidated Financial Statements).
The following table presents Commissions and fees revenue for the years
ended December 31:
In millions of dollars 2012 2011 2010
Credit cards and bank cards $ 3,526 $ 3,603 $ 3,774
Investment banking 2,991 2,451 2,977
Trading-related 2,296 2,587 2,368
Transaction services 1,441 1,520 1,454
Other Consumer (1) 878 931 1,156
Checking-related 907 926 1,023
Primerica —— 91
Loan servicing 313 251 353
Corporate finance (2) 516 519 439
Other 58 62 23
Total commissions and fees $12,926 $12,850 $13,658
(1) Primarily consists of fees for investment fund administration and management, third-party collections,
commercial demand deposit accounts and certain credit card services.
(2) Consists primarily of fees earned from structuring and underwriting loan syndications.