Citibank 2012 Annual Report Download - page 294
Download and view the complete annual report
Please find page 294 of the 2012 Citibank annual report below. You can navigate through the pages in the report by either clicking on the pages listed below, or by using the keyword search tool below to find specific information within the annual report.-
 1
1 -
2
-
3
-
4
-
5
-
6
-
7
-
8
-
9
-
10
-
11
-
12
-
13
-
14
-
15
-
16
-
17
-
18
-
19
-
20
-
21
-
22
-
23
-
24
-
25
-
26
-
27
-
28
-
29
-
30
-
31
-
32
-
33
-
34
-
35
-
36
-
37
-
38
-
39
-
40
-
41
-
42
-
43
-
44
-
45
-
46
-
47
-
48
-
49
-
50
-
51
-
52
-
53
-
54
-
55
-
56
-
57
-
58
-
59
-
60
-
61
-
62
-
63
-
64
-
65
-
66
-
67
-
68
-
69
-
70
-
71
-
72
-
73
-
74
-
75
-
76
-
77
-
78
-
79
-
80
-
81
-
82
-
83
-
84
-
85
-
86
-
87
-
88
-
89
-
90
-
91
-
92
-
93
-
94
-
95
-
96
-
97
-
98
-
99
-
100
-
101
-
102
-
103
-
104
-
105
-
106
-
107
-
108
-
109
-
110
-
111
-
112
-
113
-
114
-
115
-
116
-
117
-
118
-
119
-
120
-
121
-
122
-
123
-
124
-
125
-
126
-
127
-
128
-
129
-
130
-
131
-
132
-
133
-
134
-
135
-
136
-
137
-
138
-
139
-
140
-
141
-
142
-
143
-
144
-
145
-
146
-
147
-
148
-
149
-
150
-
151
-
152
-
153
-
154
-
155
-
156
-
157
-
158
-
159
-
160
-
161
-
162
-
163
-
164
-
165
-
166
-
167
-
168
-
169
-
170
-
171
-
172
-
173
-
174
-
175
-
176
-
177
-
178
-
179
-
180
-
181
-
182
-
183
-
184
-
185
-
186
-
187
-
188
-
189
-
190
-
191
-
192
-
193
-
194
-
195
-
196
-
197
-
198
-
199
-
200
-
201
-
202
-
203
-
204
-
205
-
206
-
207
-
208
-
209
-
210
-
211
-
212
-
213
-
214
-
215
-
216
-
217
-
218
-
219
-
220
-
221
-
222
-
223
-
224
-
225
-
226
-
227
-
228
-
229
-
230
-
231
-
232
-
233
-
234
-
235
-
236
-
237
-
238
-
239
-
240
-
241
-
242
-
243
-
244
-
245
-
246
-
247
-
248
-
249
-
250
-
251
-
252
-
253
-
254
-
255
-
256
-
257
-
258
-
259
-
260
-
261
-
262
-
263
-
264
-
265
-
266
-
267
-
268
-
269
-
270
-
271
-
272
-
273
-
274
-
275
-
276
-
277
-
278
-
279
-
280
-
281
-
282
-
283
-
 284
284 -
 285
285 -
 286
286 -
 287
287 -
 288
288 -
 289
289 -
 290
290 -
 291
291 -
 292
292 -
 293
293 -
 294
294 -
 295
295 -
 296
296 -
 297
297 -
 298
298 -
 299
299 -
 300
300 -
 301
301 -
 302
302 -
 303
303 -
 304
304 -
305
-
306
-
307
-
308
-
309
-
310
-
311
-
312
-
313
-
314
-
315
-
316
-
317
-
318
-
319
-
320
-
321
-
322
-
323
-
324
 |
 |

272
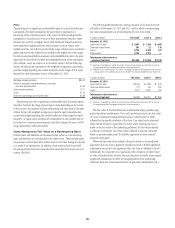
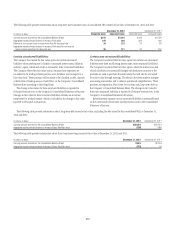
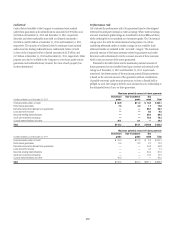
The following table provides information about certain mortgage loans HFS carried at fair value at December 31, 2012 and 2011:
In millions of dollars December 31, 2012 December 31, 2011
Carrying amount reported on the Consolidated Balance Sheet $6,879 $6,213
Aggregate fair value in excess of unpaid principal balance 390 274
Balance of non-accrual loans or loans more than 90 days past due ——
Aggregate unpaid principal balance in excess of fair value for non-accrual loans or loans more than 90 days past due ——
The changes in fair values of these mortgage loans are reported in Other
revenue in the Company’s Consolidated Statement of Income. There was
no change in fair value during the year ended December 31, 2012 due to
instrument-specific credit risk. The change in fair value during the year
ended December 31, 2011 due to instrument-specific credit risk resulted in a
loss of $0.1 million. Related interest income continues to be measured based
on the contractual interest rates and reported as such in the Consolidated
Statement of Income.
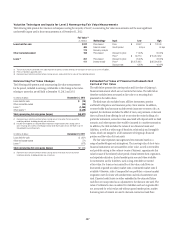
Certain consolidated VIEs
The Company has elected the fair value option for all qualified assets
and liabilities of certain VIEs that were consolidated upon the adoption
of SFAS 167 on January 1, 2010, including certain private label mortgage
securitizations, mutual fund deferred sales commissions and collateralized
loan obligation VIEs. The Company elected the fair value option for these
VIEs, as the Company believes this method better reflects the economic risks,
since substantially all of the Company’s retained interests in these entities are
carried at fair value.
With respect to the consolidated mortgage VIEs, the Company determined
the fair value for the mortgage loans and long-term debt utilizing internal
valuation techniques. The fair value of the long-term debt measured using
internal valuation techniques is verified, where possible, to prices obtained
from independent vendors. Vendors compile prices from various sources and
may apply matrix pricing for similar securities when no price is observable.
Security pricing associated with long-term debt that is valued using
observable inputs is classified as Level 2, and debt that is valued using one or
more significant unobservable inputs is classified as Level 3. The fair value
of mortgage loans of each VIE is derived from the security pricing. When
substantially all of the long-term debt of a VIE is valued using Level 2 inputs,
the corresponding mortgage loans are classified as Level 2. Otherwise, the
mortgage loans of a VIE are classified as Level 3.
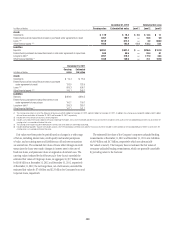
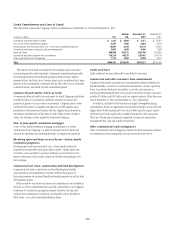
With respect to the consolidated mortgage VIEs for which the fair
value option was elected, the mortgage loans are classified as Loans on
Citigroup’s Consolidated Balance Sheet. The changes in fair value of
the loans are reported as Other revenue in the Company’s Consolidated
Statement of Income. Related interest revenue is measured based on the
contractual interest rates and reported as Interest revenue in the Company’s
Consolidated Statement of Income. Information about these mortgage loans
is included in the table below. The change in fair value of these loans due to
instrument-specific credit risk was a loss of $107 million and $275 million
for the years ended December 31, 2012 and 2011, respectively.
The debt issued by these consolidated VIEs is classified as long-term
debt on Citigroup’s Consolidated Balance Sheet. The changes in fair value
for the majority of these liabilities are reported in Other revenue in the
Company’s Consolidated Statement of Income. Related interest expense is
measured based on the contractual interest rates and reported as such in
the Consolidated Statement of Income. The aggregate unpaid principal
balance of long-term debt of these consolidated VIEs exceeded the aggregate
fair value by $869 million and $984 million as of December 31, 2012 and
2011, respectively.