Citibank 2012 Annual Report Download - page 56
Download and view the complete annual report
Please find page 56 of the 2012 Citibank annual report below. You can navigate through the pages in the report by either clicking on the pages listed below, or by using the keyword search tool below to find specific information within the annual report.-
 1
1 -
2
-
3
-
4
-
5
-
6
-
7
-
8
-
9
-
10
-
11
-
12
-
13
-
14
-
15
-
16
-
17
-
18
-
19
-
20
-
21
-
22
-
23
-
24
-
25
-
26
-
27
-
28
-
29
-
30
-
31
-
32
-
33
-
34
-
35
-
36
-
37
-
38
-
39
-
40
-
41
-
42
-
43
-
44
-
45
-
 46
46 -
 47
47 -
 48
48 -
 49
49 -
 50
50 -
 51
51 -
 52
52 -
 53
53 -
 54
54 -
 55
55 -
 56
56 -
 57
57 -
 58
58 -
 59
59 -
 60
60 -
 61
61 -
 62
62 -
 63
63 -
 64
64 -
 65
65 -
 66
66 -
67
-
68
-
69
-
70
-
71
-
72
-
73
-
74
-
75
-
76
-
77
-
78
-
79
-
80
-
81
-
82
-
83
-
84
-
85
-
86
-
87
-
88
-
89
-
90
-
91
-
92
-
93
-
94
-
95
-
96
-
97
-
98
-
99
-
100
-
101
-
102
-
103
-
104
-
105
-
106
-
107
-
108
-
109
-
110
-
111
-
112
-
113
-
114
-
115
-
116
-
117
-
118
-
119
-
120
-
121
-
122
-
123
-
124
-
125
-
126
-
127
-
128
-
129
-
130
-
131
-
132
-
133
-
134
-
135
-
136
-
137
-
138
-
139
-
140
-
141
-
142
-
143
-
144
-
145
-
146
-
147
-
148
-
149
-
150
-
151
-
152
-
153
-
154
-
155
-
156
-
157
-
158
-
159
-
160
-
161
-
162
-
163
-
164
-
165
-
166
-
167
-
168
-
169
-
170
-
171
-
172
-
173
-
174
-
175
-
176
-
177
-
178
-
179
-
180
-
181
-
182
-
183
-
184
-
185
-
186
-
187
-
188
-
189
-
190
-
191
-
192
-
193
-
194
-
195
-
196
-
197
-
198
-
199
-
200
-
201
-
202
-
203
-
204
-
205
-
206
-
207
-
208
-
209
-
210
-
211
-
212
-
213
-
214
-
215
-
216
-
217
-
218
-
219
-
220
-
221
-
222
-
223
-
224
-
225
-
226
-
227
-
228
-
229
-
230
-
231
-
232
-
233
-
234
-
235
-
236
-
237
-
238
-
239
-
240
-
241
-
242
-
243
-
244
-
245
-
246
-
247
-
248
-
249
-
250
-
251
-
252
-
253
-
254
-
255
-
256
-
257
-
258
-
259
-
260
-
261
-
262
-
263
-
264
-
265
-
266
-
267
-
268
-
269
-
270
-
271
-
272
-
273
-
274
-
275
-
276
-
277
-
278
-
279
-
280
-
281
-
282
-
283
-
284
-
285
-
286
-
287
-
288
-
289
-
290
-
291
-
292
-
293
-
294
-
295
-
296
-
297
-
298
-
299
-
300
-
301
-
302
-
303
-
304
-
305
-
306
-
307
-
308
-
309
-
310
-
311
-
312
-
313
-
314
-
315
-
316
-
317
-
318
-
319
-
320
-
321
-
322
-
323
-
324
 |
 |
34
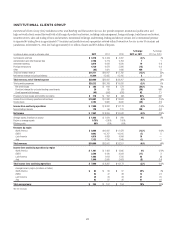
of $146 million related to the national mortgage settlement. Citi expects
that net credit losses in LCL will continue to be negatively impacted by
Citi’s fulfillment of the terms of the national mortgage settlement through
the second quarter of 2013 (see “Managing Global Risk—Credit Risk—
National Mortgage Settlement” below).
Excluding the incremental charge-offs arising from the OCC guidance
and the previously deferred balances on modified mortgages, net credit losses
in LCL would have declined 35%, with net credit losses in North America
mortgages decreasing by 20%, other portfolios in North America by 56%
and international by 49%. These declines were driven by lower overall asset
levels driven partly by the sale of delinquent loans as well as underlying credit
improvements. While Citi expects some continued improvement in credit
going forward, declines in net credit losses in LCL will largely be driven by
declines in asset levels, including continued sales of delinquent residential
first mortgages (see “Managing Global Risk—Credit Risk—North America
Consumer Mortgage Lending—North America Consumer Mortgage
Quarterly Credit Trends” below).
Average assets declined 24%, driven by the impact of asset sales and
portfolio run-off, including declines of $16 billion in North America
mortgage loans and $11 billion in international average assets.
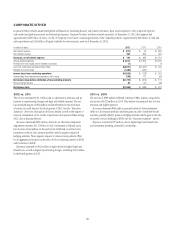
2011 vs. 2010
The net loss decreased 18%, driven primarily by the improving credit
environment, including lower net credit losses and higher loan loss reserve
releases in mortgages. The improvement in credit was partly offset by lower
revenues due to decreasing asset balances and sales.
Revenues decreased 38%, driven primarily by the lower asset balances due
to asset sales, divestitures and run-offs, which also drove the 40% decline in
net interest revenue. Non-interest revenue decreased 30% due to the impact
of divestitures. The repurchase reserve build was $945 million compared to
$917 million in 2010.
Expenses decreased 6%, driven by the lower volumes and divestitures,
partly offset by higher legal and related expenses, including those relating to
the national mortgage settlement, reserves related to potential PPI refunds
(see “Payment Protection Insurance” below) and implementation costs
associated with the Federal Reserve Board and OCC consent orders (see
“Managing Global Risk—Credit Risk—North America Consumer Mortgage
Lending—National Mortgage Settlement” below).
Provisions decreased 43%, driven by lower credit losses and higher loan
loss reserve releases. Net credit losses decreased 37%, primarily due to the
credit improvements of $1.6 billion in North America mortgages, although
the pace of the decline in net credit losses slowed. Loan loss reserve releases
increased 85%, driven by higher releases in CitiFinancial North America due
to better credit quality and lower loan balances.
Average assets declined 34%, primarily driven by portfolio run-off and the
impact of asset sales and divestitures, including continued sales of student
loans, auto loans and delinquent mortgages.