Citibank 2012 Annual Report Download - page 230
Download and view the complete annual report
Please find page 230 of the 2012 Citibank annual report below. You can navigate through the pages in the report by either clicking on the pages listed below, or by using the keyword search tool below to find specific information within the annual report.-
 1
1 -
2
-
3
-
4
-
5
-
6
-
7
-
8
-
9
-
10
-
11
-
12
-
13
-
14
-
15
-
16
-
17
-
18
-
19
-
20
-
21
-
22
-
23
-
24
-
25
-
26
-
27
-
28
-
29
-
30
-
31
-
32
-
33
-
34
-
35
-
36
-
37
-
38
-
39
-
40
-
41
-
42
-
43
-
44
-
45
-
46
-
47
-
48
-
49
-
50
-
51
-
52
-
53
-
54
-
55
-
56
-
57
-
58
-
59
-
60
-
61
-
62
-
63
-
64
-
65
-
66
-
67
-
68
-
69
-
70
-
71
-
72
-
73
-
74
-
75
-
76
-
77
-
78
-
79
-
80
-
81
-
82
-
83
-
84
-
85
-
86
-
87
-
88
-
89
-
90
-
91
-
92
-
93
-
94
-
95
-
96
-
97
-
98
-
99
-
100
-
101
-
102
-
103
-
104
-
105
-
106
-
107
-
108
-
109
-
110
-
111
-
112
-
113
-
114
-
115
-
116
-
117
-
118
-
119
-
120
-
121
-
122
-
123
-
124
-
125
-
126
-
127
-
128
-
129
-
130
-
131
-
132
-
133
-
134
-
135
-
136
-
137
-
138
-
139
-
140
-
141
-
142
-
143
-
144
-
145
-
146
-
147
-
148
-
149
-
150
-
151
-
152
-
153
-
154
-
155
-
156
-
157
-
158
-
159
-
160
-
161
-
162
-
163
-
164
-
165
-
166
-
167
-
168
-
169
-
170
-
171
-
172
-
173
-
174
-
175
-
176
-
177
-
178
-
179
-
180
-
181
-
182
-
183
-
184
-
185
-
186
-
187
-
188
-
189
-
190
-
191
-
192
-
193
-
194
-
195
-
196
-
197
-
198
-
199
-
200
-
201
-
202
-
203
-
204
-
205
-
206
-
207
-
208
-
209
-
210
-
211
-
212
-
213
-
214
-
215
-
216
-
217
-
218
-
219
-
 220
220 -
 221
221 -
 222
222 -
 223
223 -
 224
224 -
 225
225 -
 226
226 -
 227
227 -
 228
228 -
 229
229 -
 230
230 -
 231
231 -
 232
232 -
 233
233 -
 234
234 -
 235
235 -
 236
236 -
 237
237 -
 238
238 -
 239
239 -
 240
240 -
241
-
242
-
243
-
244
-
245
-
246
-
247
-
248
-
249
-
250
-
251
-
252
-
253
-
254
-
255
-
256
-
257
-
258
-
259
-
260
-
261
-
262
-
263
-
264
-
265
-
266
-
267
-
268
-
269
-
270
-
271
-
272
-
273
-
274
-
275
-
276
-
277
-
278
-
279
-
280
-
281
-
282
-
283
-
284
-
285
-
286
-
287
-
288
-
289
-
290
-
291
-
292
-
293
-
294
-
295
-
296
-
297
-
298
-
299
-
300
-
301
-
302
-
303
-
304
-
305
-
306
-
307
-
308
-
309
-
310
-
311
-
312
-
313
-
314
-
315
-
316
-
317
-
318
-
319
-
320
-
321
-
322
-
323
-
324
 |
 |

208
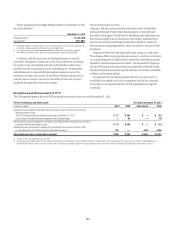
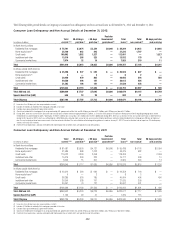
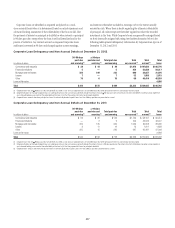
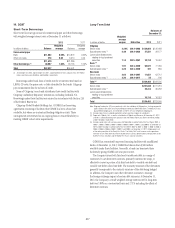
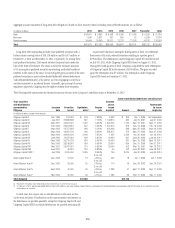
Citigroup has a risk management process to monitor, evaluate and
manage the principal risks associated with its Corporate loan portfolio. As
part of its risk management process, Citi assigns numeric risk ratings to its
Corporate loan facilities based on quantitative and qualitative assessments
of the obligor and facility. These risk ratings are reviewed at least annually
or more often if material events related to the obligor or facility warrant.
Factors considered in assigning the risk ratings include: financial condition
of the obligor, qualitative assessment of management and strategy, amount
and sources of repayment, amount and type of collateral and guarantee
arrangements, amount and type of any contingencies associated with the
obligor, and the obligor’s industry and geography.
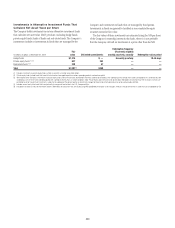
The obligor risk ratings are defined by ranges of default probabilities. The
facility risk ratings are defined by ranges of loss norms, which are the product
of the probability of default and the loss given default. The investment grade
rating categories are similar to the category BBB-/Baa3 and above as defined
by S&P and Moody’s. Loans classified according to the bank regulatory
definitions as special mention, substandard and doubtful will have risk
ratings within the non-investment grade categories.
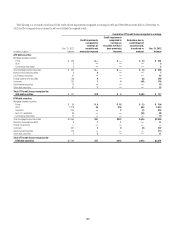
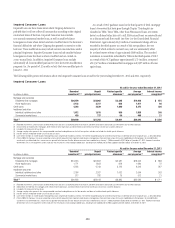
Corporate Loans Credit Quality Indicators at
December 31, 2012 and December 31, 2011
Recorded investment in loans (1)
In millions of dollars
December 31,
2012
December 31,
2011
Investment grade (2)
Commercial and industrial $ 73,822 $ 67,282
Financial institutions 43,895 35,159
Mortgage and real estate 12,587 10,729
Leases 1,404 1,161
Other 42,575 42,428
Total investment grade $174,283 $156,759
Non-investment grade (2)
Accrual
Commercial and industrial $ 33,876 $ 30,998
Financial institutions 9,968 7,485
Mortgage and real estate 2,858 3,812
Leases 559 664
Other 3,915 4,293
Non-accrual
Commercial and industrial 1,078 1,134
Financial institutions 454 763
Mortgage and real estate 680 1,039
Leases 52 13
Other 69 287
Total non-investment grade $ 53,509 $ 50,488
Private Banking loans managed on a
delinquency basis (2) $ 14,945 $ 12,716
Loans at fair value 4,056 3,939
Corporate loans, net of unearned income $246,793 $223,902
(1) Recorded investment in a loan includes net deferred loan fees and costs, unamortized premium or
discount, less any direct write-downs.
(2) Held-for-investment loans accounted for on an amortized cost basis.
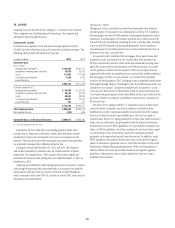
Corporate loans and leases identified as impaired and placed on
non-accrual status are written down to the extent that principal is judged
to be uncollectible. Impaired collateral-dependent loans and leases, where
repayment is expected to be provided solely by the sale of the underlying
collateral and there are no other available and reliable sources of repayment,
are written down to the lower of cost or collateral value, less cost to sell.
Cash-basis loans are returned to an accrual status when all contractual
principal and interest amounts are reasonably assured of repayment and
there is a sustained period of repayment performance, generally six months,
in accordance with the contractual terms of the loan.