Citibank 2012 Annual Report Download - page 226
Download and view the complete annual report
Please find page 226 of the 2012 Citibank annual report below. You can navigate through the pages in the report by either clicking on the pages listed below, or by using the keyword search tool below to find specific information within the annual report.-
 1
1 -
2
-
3
-
4
-
5
-
6
-
7
-
8
-
9
-
10
-
11
-
12
-
13
-
14
-
15
-
16
-
17
-
18
-
19
-
20
-
21
-
22
-
23
-
24
-
25
-
26
-
27
-
28
-
29
-
30
-
31
-
32
-
33
-
34
-
35
-
36
-
37
-
38
-
39
-
40
-
41
-
42
-
43
-
44
-
45
-
46
-
47
-
48
-
49
-
50
-
51
-
52
-
53
-
54
-
55
-
56
-
57
-
58
-
59
-
60
-
61
-
62
-
63
-
64
-
65
-
66
-
67
-
68
-
69
-
70
-
71
-
72
-
73
-
74
-
75
-
76
-
77
-
78
-
79
-
80
-
81
-
82
-
83
-
84
-
85
-
86
-
87
-
88
-
89
-
90
-
91
-
92
-
93
-
94
-
95
-
96
-
97
-
98
-
99
-
100
-
101
-
102
-
103
-
104
-
105
-
106
-
107
-
108
-
109
-
110
-
111
-
112
-
113
-
114
-
115
-
116
-
117
-
118
-
119
-
120
-
121
-
122
-
123
-
124
-
125
-
126
-
127
-
128
-
129
-
130
-
131
-
132
-
133
-
134
-
135
-
136
-
137
-
138
-
139
-
140
-
141
-
142
-
143
-
144
-
145
-
146
-
147
-
148
-
149
-
150
-
151
-
152
-
153
-
154
-
155
-
156
-
157
-
158
-
159
-
160
-
161
-
162
-
163
-
164
-
165
-
166
-
167
-
168
-
169
-
170
-
171
-
172
-
173
-
174
-
175
-
176
-
177
-
178
-
179
-
180
-
181
-
182
-
183
-
184
-
185
-
186
-
187
-
188
-
189
-
190
-
191
-
192
-
193
-
194
-
195
-
196
-
197
-
198
-
199
-
200
-
201
-
202
-
203
-
204
-
205
-
206
-
207
-
208
-
209
-
210
-
211
-
212
-
213
-
214
-
215
-
 216
216 -
 217
217 -
 218
218 -
 219
219 -
 220
220 -
 221
221 -
 222
222 -
 223
223 -
 224
224 -
 225
225 -
 226
226 -
 227
227 -
 228
228 -
 229
229 -
 230
230 -
 231
231 -
 232
232 -
 233
233 -
 234
234 -
 235
235 -
 236
236 -
237
-
238
-
239
-
240
-
241
-
242
-
243
-
244
-
245
-
246
-
247
-
248
-
249
-
250
-
251
-
252
-
253
-
254
-
255
-
256
-
257
-
258
-
259
-
260
-
261
-
262
-
263
-
264
-
265
-
266
-
267
-
268
-
269
-
270
-
271
-
272
-
273
-
274
-
275
-
276
-
277
-
278
-
279
-
280
-
281
-
282
-
283
-
284
-
285
-
286
-
287
-
288
-
289
-
290
-
291
-
292
-
293
-
294
-
295
-
296
-
297
-
298
-
299
-
300
-
301
-
302
-
303
-
304
-
305
-
306
-
307
-
308
-
309
-
310
-
311
-
312
-
313
-
314
-
315
-
316
-
317
-
318
-
319
-
320
-
321
-
322
-
323
-
324
 |
 |

204
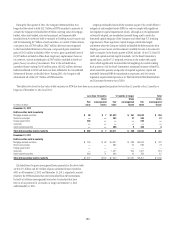
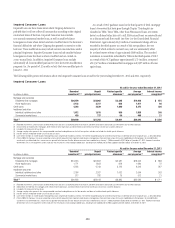
Impaired Consumer Loans
Impaired loans are those loans about which Citigroup believes it is
probable that it will not collect all amounts due according to the original
contractual terms of the loan. Impaired Consumer loans include
non-accrual commercial market loans, as well as smaller-balance
homogeneous loans whose terms have been modified due to the borrower’s
financial difficulties and where Citigroup has granted a concession to the
borrower. These modifications may include interest rate reductions and/or
principal forgiveness. Impaired Consumer loans exclude smaller-balance
homogeneous loans that have not been modified and are carried on
a non-accrual basis. In addition, impaired Consumer loans exclude
substantially all loans modified pursuant to Citi’s short-term modification
programs (i.e., for periods of 12 months or less) that were modified prior to
January 1, 2011.
As a result of OCC guidance issued in the third quarter of 2012, mortgage
loans to borrowers that have gone through Chapter 7 bankruptcy are
classified as TDRs. These TDRs, other than FHA-insured loans, are written
down to collateral value less cost to sell. FHA-insured loans are reserved based
on a discounted cash flow model (see Note 1 to the Consolidated Financial
Statements). Approximately $635 million of incremental charge-offs was
recorded in the third quarter as a result of this new guidance, the vast
majority of which related to current loans, and was substantially offset
by a related reserve release of approximately $600 million. The recorded
investment in receivables reclassified to TDRs in the third quarter of 2012
as a result of this OCC guidance approximated $1,714 million, composed
of $1,327 million of residential first mortgages and $387 million of home
equity loans.
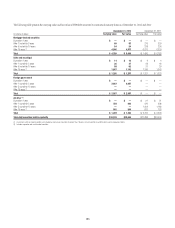
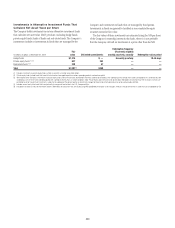
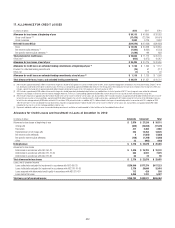
The following tables present information about total impaired Consumer loans at and for the years ending December 31, 2012 and 2011, respectively:
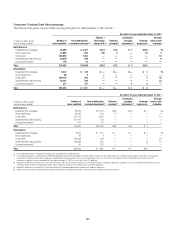
Impaired Consumer Loans
At and for the year ended December 31, 2012
In millions of dollars
Recorded
investment (1)(2)
Unpaid
principal balance
Related specific
allowance (3)
Average
carrying value (4)
Interest income
recognized (5)(6)
Mortgage and real estate
Residential first mortgages $20,870 $22,062 $3,585 $19,956 $ 875
Home equity loans 2,135 2,727 636 1,911 68
Credit cards 4,584 4,639 1,800 5,272 308
Installment and other
Individual installment and other 1,612 1,618 860 1,958 248
Commercial market loans 439 737 60 495 21
Total (7) $29,640 $31,783 $6,941 $29,592 $ 1,520
(1) Recorded investment in a loan includes net deferred loan fees and costs, unamortized premium or discount and direct write-downs and includes accrued interest only on credit card loans.
(2) $2,344 million of residential first mortgages, $378 million of home equity loans and $183 million of commercial market loans do not have a specific allowance.
(3) Included in the Allowance for loan losses.
(4) Average carrying value represents the average recorded investment ending balance for the last four quarters and does not include the related specific allowance.
(5) Includes amounts recognized on both an accrual and cash basis.
(6) Cash interest receipts on smaller-balance homogeneous loans are generally recorded as revenue. The interest recognition policy for commercial market loans is identical to that for Corporate loans, as described below.
(7) Prior to 2008, the Company’s financial accounting systems did not separately track impaired smaller-balance, homogeneous Consumer loans whose terms were modified due to the borrowers’ financial difficulties
and where it was determined that a concession was granted to the borrower. Smaller-balance consumer loans modified since January 1, 2008 amounted to $29.2 billion at December 31, 2012. However, information
derived from Citi’s risk management systems indicates that the amounts of outstanding modified loans, including those modified prior to 2008, approximated $30.1 billion at December 31, 2012.
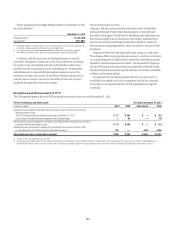
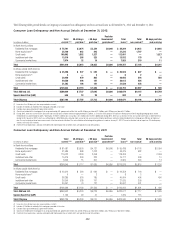
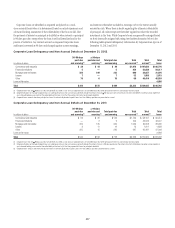
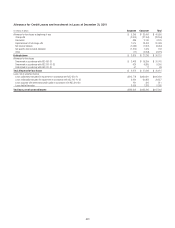
At and for the year ended December 31, 2011
In millions of dollars
Recorded
investment (1)(2)
Unpaid
principal balance
Related specific
allowance (3)
Average
carrying value (4)
Interest income
recognized (5)(6)
Mortgage and real estate
Residential first mortgages $19,616 $20,803 $3,987 $18,642 $ 888
Home equity loans 1,771 1,823 669 1,680 72
Credit cards 6,695 6,743 3,122 6,542 387
Installment and other
Individual installment and other 2,264 2,267 1,032 2,644 343
Commercial market loans 517 782 75 572 21
Total (7) $30,863 $32,418 $ 8,885 $30,080 $ 1,711
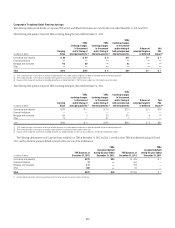
(1) Recorded investment in a loan includes net deferred loan fees and costs, unamortized premium or discount and direct write-downs and includes accrued interest only on credit card loans.
(2) $858 million of residential first mortgages, $16 million of home equity loans and $182 million of commercial market loans do not have a specific allowance.
(3) Included in the Allowance for loan losses.
(4) Average carrying value represents the average recorded investment ending balance for last four quarters and does not include related specific allowance.
(5) Includes amounts recognized on both an accrual and cash basis.
(6) Cash interest receipts on smaller-balance homogeneous loans are generally recorded as revenue. The interest recognition policy for commercial market loans is identical to that for Corporate loans, as described below.
(7) Prior to 2008, the Company’s financial accounting systems did not separately track impaired smaller-balance, homogeneous Consumer loans whose terms were modified due to the borrowers’ financial difficulties
and where it was determined that a concession was granted to the borrower. Smaller-balance consumer loans modified since January 1, 2008 amounted to $30.3 billion at December 31, 2011. However, information
derived from Citi’s risk management systems indicates that the amounts of outstanding modified loans, including those modified prior to 2008, approximated $31.5 billion at December 31, 2011.