Citibank 2012 Annual Report Download - page 216
Download and view the complete annual report
Please find page 216 of the 2012 Citibank annual report below. You can navigate through the pages in the report by either clicking on the pages listed below, or by using the keyword search tool below to find specific information within the annual report.-
 1
1 -
2
-
3
-
4
-
5
-
6
-
7
-
8
-
9
-
10
-
11
-
12
-
13
-
14
-
15
-
16
-
17
-
18
-
19
-
20
-
21
-
22
-
23
-
24
-
25
-
26
-
27
-
28
-
29
-
30
-
31
-
32
-
33
-
34
-
35
-
36
-
37
-
38
-
39
-
40
-
41
-
42
-
43
-
44
-
45
-
46
-
47
-
48
-
49
-
50
-
51
-
52
-
53
-
54
-
55
-
56
-
57
-
58
-
59
-
60
-
61
-
62
-
63
-
64
-
65
-
66
-
67
-
68
-
69
-
70
-
71
-
72
-
73
-
74
-
75
-
76
-
77
-
78
-
79
-
80
-
81
-
82
-
83
-
84
-
85
-
86
-
87
-
88
-
89
-
90
-
91
-
92
-
93
-
94
-
95
-
96
-
97
-
98
-
99
-
100
-
101
-
102
-
103
-
104
-
105
-
106
-
107
-
108
-
109
-
110
-
111
-
112
-
113
-
114
-
115
-
116
-
117
-
118
-
119
-
120
-
121
-
122
-
123
-
124
-
125
-
126
-
127
-
128
-
129
-
130
-
131
-
132
-
133
-
134
-
135
-
136
-
137
-
138
-
139
-
140
-
141
-
142
-
143
-
144
-
145
-
146
-
147
-
148
-
149
-
150
-
151
-
152
-
153
-
154
-
155
-
156
-
157
-
158
-
159
-
160
-
161
-
162
-
163
-
164
-
165
-
166
-
167
-
168
-
169
-
170
-
171
-
172
-
173
-
174
-
175
-
176
-
177
-
178
-
179
-
180
-
181
-
182
-
183
-
184
-
185
-
186
-
187
-
188
-
189
-
190
-
191
-
192
-
193
-
194
-
195
-
196
-
197
-
198
-
199
-
200
-
201
-
202
-
203
-
204
-
205
-
 206
206 -
 207
207 -
 208
208 -
 209
209 -
 210
210 -
 211
211 -
 212
212 -
 213
213 -
 214
214 -
 215
215 -
 216
216 -
 217
217 -
 218
218 -
 219
219 -
 220
220 -
 221
221 -
 222
222 -
 223
223 -
 224
224 -
 225
225 -
 226
226 -
227
-
228
-
229
-
230
-
231
-
232
-
233
-
234
-
235
-
236
-
237
-
238
-
239
-
240
-
241
-
242
-
243
-
244
-
245
-
246
-
247
-
248
-
249
-
250
-
251
-
252
-
253
-
254
-
255
-
256
-
257
-
258
-
259
-
260
-
261
-
262
-
263
-
264
-
265
-
266
-
267
-
268
-
269
-
270
-
271
-
272
-
273
-
274
-
275
-
276
-
277
-
278
-
279
-
280
-
281
-
282
-
283
-
284
-
285
-
286
-
287
-
288
-
289
-
290
-
291
-
292
-
293
-
294
-
295
-
296
-
297
-
298
-
299
-
300
-
301
-
302
-
303
-
304
-
305
-
306
-
307
-
308
-
309
-
310
-
311
-
312
-
313
-
314
-
315
-
316
-
317
-
318
-
319
-
320
-
321
-
322
-
323
-
324
 |
 |

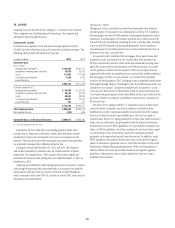
194
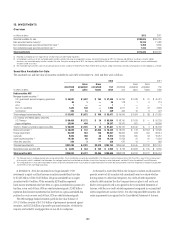
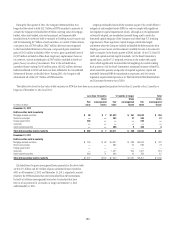
During the first quarter of 2011, the Company determined that it no
longer had the intent to hold $12.7 billion of HTM securities to maturity. As
a result, the Company reclassified $10.0 billion carrying value of mortgage-
backed, other asset-backed, state and municipal, and corporate debt
securities from Investments held-to-maturity to Trading account assets and
sold the remaining $2.7 billion of such securities. As a result of these actions,
a net pretax loss of $709 million ($427 million after-tax) was recognized
in the Consolidated Statement of Income, composed of gross unrealized
gains of $311 million included in Other revenue, gross unrealized losses of
$1,387 million included in Other-than-temporary-impairment losses on
investments, and net realized gains of $367 million included in Realized
gains (losses) on sales of investments. Prior to the reclassification,
unrealized losses totaling $1,656 million pretax ($1,012 million after-tax)
had been reflected in AOCI and have now been reflected in the Consolidated
Statement of Income, as detailed above. During 2011, the Company sold
substantially all of the $12.7 billion of HTM securities.
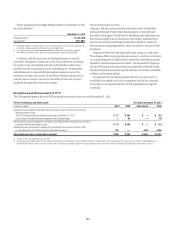
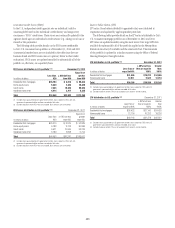
Citigroup reclassified and sold the securities as part of its overall efforts to
mitigate its risk-weighted assets (RWA) in order to comply with significant
new regulatory capital requirements which, although not yet implemented
or formally adopted, are nonetheless currently being used to assess the
forecasted capital adequacy of the Company and other large U.S. banking
organizations. These regulatory capital changes, which were largely
unforeseen when the Company initially reclassified the debt securities from
Trading account assets and Investments available-for-sale to Investments
held-to-maturity in the fourth quarter of 2008, include: (i) the U.S. Basel II
credit and operational risk capital standards; (ii) the Basel Committee’s
agreed-upon, and the U.S.-proposed, revisions to the market risk capital
rules, which significantly increased the risk weightings for certain trading
book positions; (iii) the Basel Committee’s substantial issuance of Basel III,
which raised the quantity and quality of required regulatory capital and
materially increased RWA for securitization exposures; and (iv) certain
regulatory capital-related provisions in The Dodd-Frank Wall Street Reform
and Consumer Protection Act of 2010.
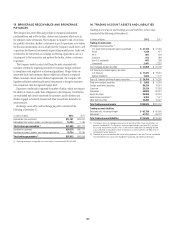
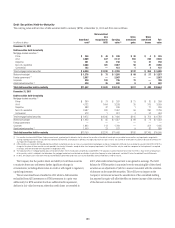
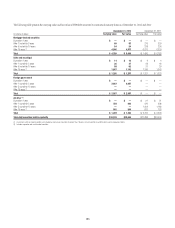
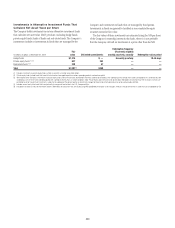
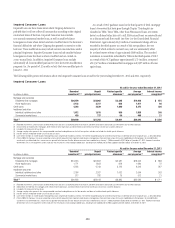
The table below shows the fair value of debt securities in HTM that have been in an unrecognized loss position for less than 12 months or for 12 months or
longer as of December 31, 2012 and 2011:
Less than 12 months 12 months or longer Total
In millions of dollars
Fair
value
Gross
unrecognized
losses
Fair
value
Gross
unrecognized
losses
Fair
value
Gross
unrecognized
losses
December 31, 2012
Debt securities held-to-maturity
Mortgage-backed securities $ 88 $ 7 $1,522 $ 351 $ 1,610 $ 358
State and municipal — — 383 37 383 37
Foreign government 294 — — — 294 —
Corporate — — — — — —
Asset-backed securities — — 406 8 406 8
Total debt securities held-to-maturity $ 382 $ 7 $ 2,311 $ 396 $2,693 $ 403
December 31, 2011
Debt securities held-to-maturity
Mortgage-backed securities $ 735 $ 63 $4,827 $ 689 $ 5,562 $ 752
State and municipal — — 682 72 682 72
Foreign government — — — — — —
Corporate — — 1,427 254 1,427 254
Asset-backed securities 480 71 306 16 786 87
Total debt securities held-to-maturity $ 1,215 $ 134 $ 7,242 $ 1,031 $ 8,457 $ 1,165
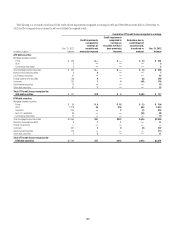
Excluded from the gross unrecognized losses presented in the above table
are the $1.5 billion and $2.3 billion of gross unrealized losses recorded in
AOCI as of December 31, 2012 and December 31, 2011, respectively, mainly
related to the HTM securities that were reclassified from AFS investments.
Virtually all of these unrecognized losses relate to securities that have
been in a loss position for 12 months or longer at December 31, 2012
and December 31, 2011.