Citibank 2012 Annual Report Download - page 164
Download and view the complete annual report
Please find page 164 of the 2012 Citibank annual report below. You can navigate through the pages in the report by either clicking on the pages listed below, or by using the keyword search tool below to find specific information within the annual report.-
 1
1 -
2
-
3
-
4
-
5
-
6
-
7
-
8
-
9
-
10
-
11
-
12
-
13
-
14
-
15
-
16
-
17
-
18
-
19
-
20
-
21
-
22
-
23
-
24
-
25
-
26
-
27
-
28
-
29
-
30
-
31
-
32
-
33
-
34
-
35
-
36
-
37
-
38
-
39
-
40
-
41
-
42
-
43
-
44
-
45
-
46
-
47
-
48
-
49
-
50
-
51
-
52
-
53
-
54
-
55
-
56
-
57
-
58
-
59
-
60
-
61
-
62
-
63
-
64
-
65
-
66
-
67
-
68
-
69
-
70
-
71
-
72
-
73
-
74
-
75
-
76
-
77
-
78
-
79
-
80
-
81
-
82
-
83
-
84
-
85
-
86
-
87
-
88
-
89
-
90
-
91
-
92
-
93
-
94
-
95
-
96
-
97
-
98
-
99
-
100
-
101
-
102
-
103
-
104
-
105
-
106
-
107
-
108
-
109
-
110
-
111
-
112
-
113
-
114
-
115
-
116
-
117
-
118
-
119
-
120
-
121
-
122
-
123
-
124
-
125
-
126
-
127
-
128
-
129
-
130
-
131
-
132
-
133
-
134
-
135
-
136
-
137
-
138
-
139
-
140
-
141
-
142
-
143
-
144
-
145
-
146
-
147
-
148
-
149
-
150
-
151
-
152
-
153
-
 154
154 -
 155
155 -
 156
156 -
 157
157 -
 158
158 -
 159
159 -
 160
160 -
 161
161 -
 162
162 -
 163
163 -
 164
164 -
 165
165 -
 166
166 -
 167
167 -
 168
168 -
 169
169 -
 170
170 -
 171
171 -
 172
172 -
 173
173 -
 174
174 -
175
-
176
-
177
-
178
-
179
-
180
-
181
-
182
-
183
-
184
-
185
-
186
-
187
-
188
-
189
-
190
-
191
-
192
-
193
-
194
-
195
-
196
-
197
-
198
-
199
-
200
-
201
-
202
-
203
-
204
-
205
-
206
-
207
-
208
-
209
-
210
-
211
-
212
-
213
-
214
-
215
-
216
-
217
-
218
-
219
-
220
-
221
-
222
-
223
-
224
-
225
-
226
-
227
-
228
-
229
-
230
-
231
-
232
-
233
-
234
-
235
-
236
-
237
-
238
-
239
-
240
-
241
-
242
-
243
-
244
-
245
-
246
-
247
-
248
-
249
-
250
-
251
-
252
-
253
-
254
-
255
-
256
-
257
-
258
-
259
-
260
-
261
-
262
-
263
-
264
-
265
-
266
-
267
-
268
-
269
-
270
-
271
-
272
-
273
-
274
-
275
-
276
-
277
-
278
-
279
-
280
-
281
-
282
-
283
-
284
-
285
-
286
-
287
-
288
-
289
-
290
-
291
-
292
-
293
-
294
-
295
-
296
-
297
-
298
-
299
-
300
-
301
-
302
-
303
-
304
-
305
-
306
-
307
-
308
-
309
-
310
-
311
-
312
-
313
-
314
-
315
-
316
-
317
-
318
-
319
-
320
-
321
-
322
-
323
-
324
 |
 |
142
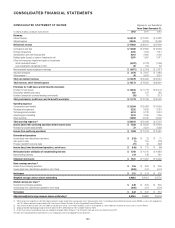
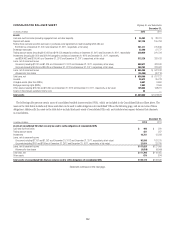
CONSOLIDATED BALANCE SHEET Citigroup Inc. and Subsidiaries
December 31,
In millions of dollars 2012 2011
Assets
Cash and due from banks (including segregated cash and other deposits) $ 36,453 $ 28,701
Deposits with banks 102,134 155,784
Federal funds sold and securities borrowed or purchased under agreements to resell (including $160,589 and
$142,862 as of December 31, 2012 and December 31, 2011, respectively, at fair value) 261,311 275,849
Brokerage receivables 22,490 27,777
Trading account assets (including $105,458 and $119,054 pledged to creditors at December 31, 2012 and December 31, 2011, respectively) 320,929 291,734
Investments (including $21,423 and $14,940 pledged to creditors at December 31, 2012 and December 31, 2011, respectively,
and $294,463 and $274,040 as of December 31, 2012 and December 31, 2011, respectively, at fair value) 312,326 293,413
Loans, net of unearned income
Consumer (including $1,231 and $1,326 as of December 31, 2012 and December 31, 2011, respectively, at fair value) 408,671 423,340
Corporate (including $4,056 and $3,939 as of December 31, 2012 and December 31, 2011, respectively, at fair value) 246,793 223,902
Loans, net of unearned income $ 655,464 $ 647,242
Allowance for loan losses (25,455) (30,115)
Total loans, net $ 630,009 $ 617,127
Goodwill 25,673 25,413
Intangible assets (other than MSRs) 5,697 6,600
Mortgage servicing rights (MSRs) 1,942 2,569
Other assets (including $13,299 and $13,360 as of December 31, 2012 and December 31, 2011, respectively, at fair value) 145,660 148,911
Assets of discontinued operations held for sale 36 —
Total assets $1,864,660 $1,873,878
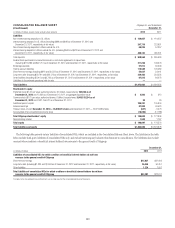
The following table presents certain assets of consolidated variable interest entities (VIEs), which are included in the Consolidated Balance Sheet above. The
assets in the table below include only those assets that can be used to settle obligations of consolidated VIEs on the following page, and are in excess of those
obligations. Additionally, the assets in the table below include third-party assets of consolidated VIEs only, and exclude intercompany balances that eliminate
in consolidation.
December 31,
In millions of dollars 2012 2011
Assets of consolidated VIEs that can only be used to settle obligations of consolidated VIEs
Cash and due from banks $ 498 $ 591
Trading account assets 481 567
Investments 10,751 12,509
Loans, net of unearned income
Consumer (including $1,191 and $1,292 as of December 31, 2012 and December 31, 2011, respectively, at fair value) 93,936 103,275
Corporate (including $157 and $198 as of December 31, 2012 and December 31, 2011, respectively, at fair value) 23,684 23,780
Loans, net of unearned income $117,620 $127,055
Allowance for loan losses (5,854) (8,000)
Total loans, net $111,766 $119,055
Other assets 674 874
Total assets of consolidated VIEs that can only be used to settle obligations of consolidated VIEs $124,170 $133,596
Statement continues on the next page.