Citibank 2012 Annual Report Download - page 147
Download and view the complete annual report
Please find page 147 of the 2012 Citibank annual report below. You can navigate through the pages in the report by either clicking on the pages listed below, or by using the keyword search tool below to find specific information within the annual report.-
 1
1 -
2
-
3
-
4
-
5
-
6
-
7
-
8
-
9
-
10
-
11
-
12
-
13
-
14
-
15
-
16
-
17
-
18
-
19
-
20
-
21
-
22
-
23
-
24
-
25
-
26
-
27
-
28
-
29
-
30
-
31
-
32
-
33
-
34
-
35
-
36
-
37
-
38
-
39
-
40
-
41
-
42
-
43
-
44
-
45
-
46
-
47
-
48
-
49
-
50
-
51
-
52
-
53
-
54
-
55
-
56
-
57
-
58
-
59
-
60
-
61
-
62
-
63
-
64
-
65
-
66
-
67
-
68
-
69
-
70
-
71
-
72
-
73
-
74
-
75
-
76
-
77
-
78
-
79
-
80
-
81
-
82
-
83
-
84
-
85
-
86
-
87
-
88
-
89
-
90
-
91
-
92
-
93
-
94
-
95
-
96
-
97
-
98
-
99
-
100
-
101
-
102
-
103
-
104
-
105
-
106
-
107
-
108
-
109
-
110
-
111
-
112
-
113
-
114
-
115
-
116
-
117
-
118
-
119
-
120
-
121
-
122
-
123
-
124
-
125
-
126
-
127
-
128
-
129
-
130
-
131
-
132
-
133
-
134
-
135
-
136
-
 137
137 -
 138
138 -
 139
139 -
 140
140 -
 141
141 -
 142
142 -
 143
143 -
 144
144 -
 145
145 -
 146
146 -
 147
147 -
 148
148 -
 149
149 -
 150
150 -
 151
151 -
 152
152 -
 153
153 -
 154
154 -
 155
155 -
 156
156 -
 157
157 -
158
-
159
-
160
-
161
-
162
-
163
-
164
-
165
-
166
-
167
-
168
-
169
-
170
-
171
-
172
-
173
-
174
-
175
-
176
-
177
-
178
-
179
-
180
-
181
-
182
-
183
-
184
-
185
-
186
-
187
-
188
-
189
-
190
-
191
-
192
-
193
-
194
-
195
-
196
-
197
-
198
-
199
-
200
-
201
-
202
-
203
-
204
-
205
-
206
-
207
-
208
-
209
-
210
-
211
-
212
-
213
-
214
-
215
-
216
-
217
-
218
-
219
-
220
-
221
-
222
-
223
-
224
-
225
-
226
-
227
-
228
-
229
-
230
-
231
-
232
-
233
-
234
-
235
-
236
-
237
-
238
-
239
-
240
-
241
-
242
-
243
-
244
-
245
-
246
-
247
-
248
-
249
-
250
-
251
-
252
-
253
-
254
-
255
-
256
-
257
-
258
-
259
-
260
-
261
-
262
-
263
-
264
-
265
-
266
-
267
-
268
-
269
-
270
-
271
-
272
-
273
-
274
-
275
-
276
-
277
-
278
-
279
-
280
-
281
-
282
-
283
-
284
-
285
-
286
-
287
-
288
-
289
-
290
-
291
-
292
-
293
-
294
-
295
-
296
-
297
-
298
-
299
-
300
-
301
-
302
-
303
-
304
-
305
-
306
-
307
-
308
-
309
-
310
-
311
-
312
-
313
-
314
-
315
-
316
-
317
-
318
-
319
-
320
-
321
-
322
-
323
-
324
 |
 |

125
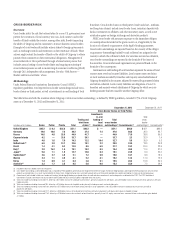
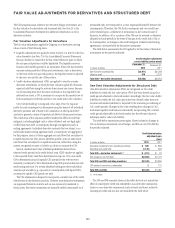
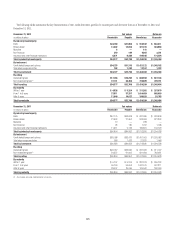
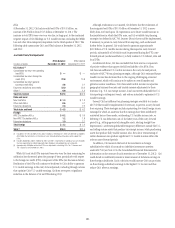
The following tables summarize the key characteristics of Citi’s credit derivatives portfolio by counterparty and derivative form as of December 31, 2012 and
December 31, 2011:
December 31, 2012 Fair values Notionals
In millions of dollars Receivable Payable Beneficiary Guarantor
By industry/counterparty
Bank $34,189 $31,960 $ 914,542 $ 863,411
Broker-dealer 13,302 14,098 321,418 304,968
Monoline 5 — 141 —
Non-financial 210 164 4,022 3,241
Insurance and other financial institutions 6,671 6,486 194,166 174,874
Total by industry/counterparty $54,377 $52,708 $1,434,289 $1,346,494
By instrument
Credit default swaps and options $54,275 $51,316 $1,421,122 $1,345,162
Total return swaps and other 102 1,392 13,167 1,332
Total by instrument $54,377 $52,708 $1,434,289 $1,346,494
By rating
Investment grade $17,236 $16,252 $ 694,590 $ 637,343
Non-investment grade (1) 37,141 36,456 739,699 709,151
Total by rating $54,377 $52,708 $1,434,289 $1,346,494
By maturity
Within 1 year $ 4,826 $ 5,324 $ 311,202 $ 287,670
From 1 to 5 years 37,911 37,357 1,014,459 965,059
After 5 years 11,640 10,027 108,628 93,765
Total by maturity $54,377 $52,708 $1,434,289 $1,346,494
December 31, 2011 Fair values Notionals
In millions of dollars Receivable Payable Beneficiary Guarantor
By industry/counterparty
Bank $57,175 $53,638 $ 981,085 $ 929,608
Broker-dealer 21,963 21,952 343,909 321,293
Monoline 10 — 238 —
Non-financial 95 130 1,797 1,048
Insurance and other financial institutions 11,611 9,132 185,861 142,579
Total by industry/counterparty $90,854 $84,852 $1,512,890 $1,394,528
By instrument
Credit default swaps and options $89,998 $83,419 $1,491,053 $1,393,082
Total return swaps and other 856 1,433 21,837 1,446
Total by instrument $90,854 $84,852 $1,512,890 $1,394,528
By rating
Investment grade $26,457 $23,846 $ 681,406 $ 611,447
Non-investment grade (1) 64,397 61,006 831,484 783,081
Total by rating $90,854 $84,852 $1,512,890 $1,394,528
By maturity
Within 1 year $ 5,707 $ 5,244 $ 281,373 $ 266,723
From 1 to 5 years 56,740 54,553 1,031,575 947,211
After 5 years 28,407 25,055 199,942 180,594
Total by maturity $90,854 $84,852 $1,512,890 $1,394,528
(1) Also includes not-rated credit derivative instruments.