Citibank 2012 Annual Report Download - page 231
Download and view the complete annual report
Please find page 231 of the 2012 Citibank annual report below. You can navigate through the pages in the report by either clicking on the pages listed below, or by using the keyword search tool below to find specific information within the annual report.-
 1
1 -
2
-
3
-
4
-
5
-
6
-
7
-
8
-
9
-
10
-
11
-
12
-
13
-
14
-
15
-
16
-
17
-
18
-
19
-
20
-
21
-
22
-
23
-
24
-
25
-
26
-
27
-
28
-
29
-
30
-
31
-
32
-
33
-
34
-
35
-
36
-
37
-
38
-
39
-
40
-
41
-
42
-
43
-
44
-
45
-
46
-
47
-
48
-
49
-
50
-
51
-
52
-
53
-
54
-
55
-
56
-
57
-
58
-
59
-
60
-
61
-
62
-
63
-
64
-
65
-
66
-
67
-
68
-
69
-
70
-
71
-
72
-
73
-
74
-
75
-
76
-
77
-
78
-
79
-
80
-
81
-
82
-
83
-
84
-
85
-
86
-
87
-
88
-
89
-
90
-
91
-
92
-
93
-
94
-
95
-
96
-
97
-
98
-
99
-
100
-
101
-
102
-
103
-
104
-
105
-
106
-
107
-
108
-
109
-
110
-
111
-
112
-
113
-
114
-
115
-
116
-
117
-
118
-
119
-
120
-
121
-
122
-
123
-
124
-
125
-
126
-
127
-
128
-
129
-
130
-
131
-
132
-
133
-
134
-
135
-
136
-
137
-
138
-
139
-
140
-
141
-
142
-
143
-
144
-
145
-
146
-
147
-
148
-
149
-
150
-
151
-
152
-
153
-
154
-
155
-
156
-
157
-
158
-
159
-
160
-
161
-
162
-
163
-
164
-
165
-
166
-
167
-
168
-
169
-
170
-
171
-
172
-
173
-
174
-
175
-
176
-
177
-
178
-
179
-
180
-
181
-
182
-
183
-
184
-
185
-
186
-
187
-
188
-
189
-
190
-
191
-
192
-
193
-
194
-
195
-
196
-
197
-
198
-
199
-
200
-
201
-
202
-
203
-
204
-
205
-
206
-
207
-
208
-
209
-
210
-
211
-
212
-
213
-
214
-
215
-
216
-
217
-
218
-
219
-
220
-
 221
221 -
 222
222 -
 223
223 -
 224
224 -
 225
225 -
 226
226 -
 227
227 -
 228
228 -
 229
229 -
 230
230 -
 231
231 -
 232
232 -
 233
233 -
 234
234 -
 235
235 -
 236
236 -
 237
237 -
 238
238 -
 239
239 -
 240
240 -
 241
241 -
242
-
243
-
244
-
245
-
246
-
247
-
248
-
249
-
250
-
251
-
252
-
253
-
254
-
255
-
256
-
257
-
258
-
259
-
260
-
261
-
262
-
263
-
264
-
265
-
266
-
267
-
268
-
269
-
270
-
271
-
272
-
273
-
274
-
275
-
276
-
277
-
278
-
279
-
280
-
281
-
282
-
283
-
284
-
285
-
286
-
287
-
288
-
289
-
290
-
291
-
292
-
293
-
294
-
295
-
296
-
297
-
298
-
299
-
300
-
301
-
302
-
303
-
304
-
305
-
306
-
307
-
308
-
309
-
310
-
311
-
312
-
313
-
314
-
315
-
316
-
317
-
318
-
319
-
320
-
321
-
322
-
323
-
324
 |
 |

209
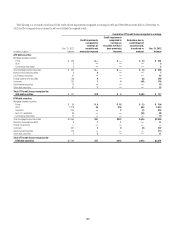
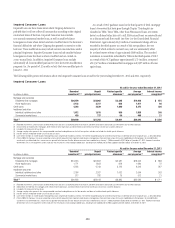
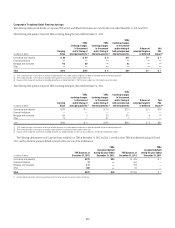
The following tables present non-accrual loan information by Corporate loan type at and for the years ended December 31, 2012, 2011 and 2010,
respectively:
Non-Accrual Corporate Loans
At and for the period ended December 31, 2012
In millions of dollars
Recorded
investment (1)
Unpaid
principal balance
Related specific
allowance
Average
carrying value (2)
Interest income
recognized
Non-accrual Corporate loans
Commercial and industrial $1,078 $1,368 $155 $1,076 $65
Financial institutions 454 504 14 518 —
Mortgage and real estate 680 810 74 811 23
Lease financing 52 61 16 19 2
Other 69 245 25 154 8
Total non-accrual Corporate loans $2,333 $2,988 $284 $2,578 $98
December 31, 2011
In millions of dollars
Recorded
investment (1)
Unpaid
principal balance
Related specific
allowance
Average
carrying value (3)
Interest income
recognized
Non-accrual Corporate loans
Commercial and industrial $1,134 $1,455 $186 $1,446 $ 76
Financial institutions 763 1,127 28 1,056 —
Mortgage and real estate 1,039 1,245 151 1,487 14
Lease financing 13 21 — 25 2
Other 287 640 55 420 17
Total non-accrual Corporate loans $3,236 $4,488 $420 $4,434 $109
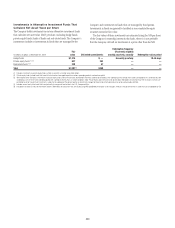
At and for the period ended
In millions of dollars
Dec. 31,
2010
Average carrying value (3) $10,643
Interest income recognized 65
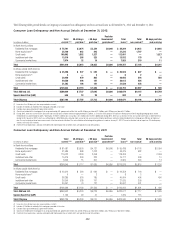
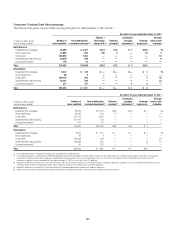
December 31, 2012 December 31, 2011
In millions of dollars
Recorded
investment (1)
Related specific
allowance
Recorded
investment (1)
Related specific
allowance
Non-accrual Corporate loans with valuation allowances
Commercial and industrial $ 608 $155 $ 501 $186
Financial institutions 41 14 78 28
Mortgage and real estate 345 74 540 151
Lease financing 47 16 — —
Other 59 25 120 55
Total non-accrual Corporate loans with specific allowance $1,100 $284 $1,239 $420
Non-accrual Corporate loans without specific allowance
Commercial and industrial $ 470 $ 633
Financial institutions 413 685
Mortgage and real estate 335 499
Lease financing 5 13
Other 10 167
Total non-accrual Corporate loans without specific allowance $1,233 N/A $1,997 N/A
(1) Recorded investment in a loan includes net deferred loan fees and costs, unamortized premium or discount, less any direct write-downs.
(2) Average carrying value represents the average recorded investment balance and does not include related specific allowance.
(3) Average carrying value does not include related specific allowance.
N/A Not Applicable