Citibank 2012 Annual Report Download - page 197
Download and view the complete annual report
Please find page 197 of the 2012 Citibank annual report below. You can navigate through the pages in the report by either clicking on the pages listed below, or by using the keyword search tool below to find specific information within the annual report.-
 1
1 -
2
-
3
-
4
-
5
-
6
-
7
-
8
-
9
-
10
-
11
-
12
-
13
-
14
-
15
-
16
-
17
-
18
-
19
-
20
-
21
-
22
-
23
-
24
-
25
-
26
-
27
-
28
-
29
-
30
-
31
-
32
-
33
-
34
-
35
-
36
-
37
-
38
-
39
-
40
-
41
-
42
-
43
-
44
-
45
-
46
-
47
-
48
-
49
-
50
-
51
-
52
-
53
-
54
-
55
-
56
-
57
-
58
-
59
-
60
-
61
-
62
-
63
-
64
-
65
-
66
-
67
-
68
-
69
-
70
-
71
-
72
-
73
-
74
-
75
-
76
-
77
-
78
-
79
-
80
-
81
-
82
-
83
-
84
-
85
-
86
-
87
-
88
-
89
-
90
-
91
-
92
-
93
-
94
-
95
-
96
-
97
-
98
-
99
-
100
-
101
-
102
-
103
-
104
-
105
-
106
-
107
-
108
-
109
-
110
-
111
-
112
-
113
-
114
-
115
-
116
-
117
-
118
-
119
-
120
-
121
-
122
-
123
-
124
-
125
-
126
-
127
-
128
-
129
-
130
-
131
-
132
-
133
-
134
-
135
-
136
-
137
-
138
-
139
-
140
-
141
-
142
-
143
-
144
-
145
-
146
-
147
-
148
-
149
-
150
-
151
-
152
-
153
-
154
-
155
-
156
-
157
-
158
-
159
-
160
-
161
-
162
-
163
-
164
-
165
-
166
-
167
-
168
-
169
-
170
-
171
-
172
-
173
-
174
-
175
-
176
-
177
-
178
-
179
-
180
-
181
-
182
-
183
-
184
-
185
-
186
-
 187
187 -
 188
188 -
 189
189 -
 190
190 -
 191
191 -
 192
192 -
 193
193 -
 194
194 -
 195
195 -
 196
196 -
 197
197 -
 198
198 -
 199
199 -
 200
200 -
 201
201 -
 202
202 -
 203
203 -
 204
204 -
 205
205 -
 206
206 -
 207
207 -
208
-
209
-
210
-
211
-
212
-
213
-
214
-
215
-
216
-
217
-
218
-
219
-
220
-
221
-
222
-
223
-
224
-
225
-
226
-
227
-
228
-
229
-
230
-
231
-
232
-
233
-
234
-
235
-
236
-
237
-
238
-
239
-
240
-
241
-
242
-
243
-
244
-
245
-
246
-
247
-
248
-
249
-
250
-
251
-
252
-
253
-
254
-
255
-
256
-
257
-
258
-
259
-
260
-
261
-
262
-
263
-
264
-
265
-
266
-
267
-
268
-
269
-
270
-
271
-
272
-
273
-
274
-
275
-
276
-
277
-
278
-
279
-
280
-
281
-
282
-
283
-
284
-
285
-
286
-
287
-
288
-
289
-
290
-
291
-
292
-
293
-
294
-
295
-
296
-
297
-
298
-
299
-
300
-
301
-
302
-
303
-
304
-
305
-
306
-
307
-
308
-
309
-
310
-
311
-
312
-
313
-
314
-
315
-
316
-
317
-
318
-
319
-
320
-
321
-
322
-
323
-
324
 |
 |

175
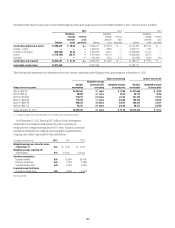
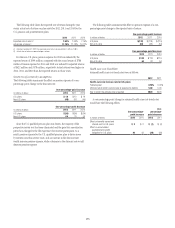
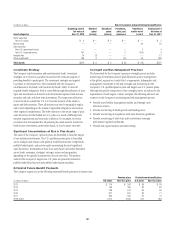
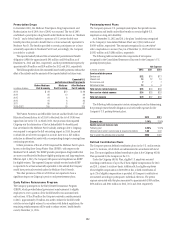
The following table shows the expected rate of return during the year
versus actual rate of return on plan assets for 2012, 2011 and 2010 for the
U.S. pension and postretirement plans:
2012 2011 2010
Expected rate of return (1) 7.50% 7.50% 7.75%
Actual rate of return (2) 11.79% 11.13% 14.11%
(1) Effective December 31, 2012, the expected rate of return decreased from 7.50% to 7.00%.
(2) Actual rates of return are presented gross of fees.
For the non-U.S. plans, pension expense for 2012 was reduced by the
expected return of $399 million, compared with the actual return of $786
million. Pension expense for 2011 and 2010 was reduced by expected returns
of $422 million and $378 million, respectively. Actual returns were higher in
2012, 2011, and 2010 than the expected returns in those years.
Sensitivities of Certain Key Assumptions
The following tables summarize the effect on pension expense of a one-
percentage-point change in the discount rate:
One-percentage-point increase
In millions of dollars 2012 2011 2010
U.S. plans $ 18 $ 19 $ 19
Non-U.S. plans (48) (57) (49)
One-percentage-point decrease
In millions of dollars 2012 2011 2010
U.S. plans $(36) $(34) $(34)
Non-U.S. plans 64 70 56
Since the U.S. qualified pension plan was frozen, the majority of the
prospective service cost has been eliminated and the gain/loss amortization
period was changed to the life expectancy for inactive participants. As a
result, pension expense for the U.S. qualified pension plan is driven more
by interest costs than service costs, and an increase in the discount rate
would increase pension expense, while a decrease in the discount rate would
decrease pension expense.
The following tables summarize the effect on pension expense of a one-
percentage-point change in the expected rates of return:
One-percentage-point increase
In millions of dollars 2012 2011 2010
U.S. plans $(120) $(118) $(119)
Non-U.S. plans (64) (62) (54)
One-percentage-point decrease
In millions of dollars 2012 2011 2010
U.S. plans $120 $118 $119
Non-U.S. plans 64 62 54
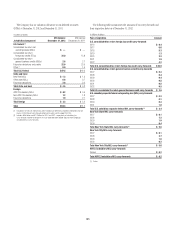
Health-Care Cost-Trend Rate
Assumed health-care cost-trend rates were as follows:
2012 2011
Health-care cost increase rate for U.S. plans
Following year 8.50% 9.00%
Ultimate rate to which cost increase is assumed to decline 5.00 5.00
Year in which the ultimate rate is reached 2020 2020
A one-percentage-point change in assumed health-care cost-trend rates
would have the following effects:
One-percentage-
point increase
One-
percentage-
point decrease
In millions of dollars 2012 2011 2012 2011
Effect on benefits earned and
interest cost for U.S. plans $ 2 $ 2 $ (1) $ (2)
Effect on accumulated
postretirement benefit
obligation for U.S. plans 44 43 (39) (38)