Citibank 2012 Annual Report Download - page 37
Download and view the complete annual report
Please find page 37 of the 2012 Citibank annual report below. You can navigate through the pages in the report by either clicking on the pages listed below, or by using the keyword search tool below to find specific information within the annual report.-
 1
1 -
2
-
3
-
4
-
5
-
6
-
7
-
8
-
9
-
10
-
11
-
12
-
13
-
14
-
15
-
16
-
17
-
18
-
19
-
20
-
21
-
22
-
23
-
24
-
25
-
26
-
 27
27 -
 28
28 -
 29
29 -
 30
30 -
 31
31 -
 32
32 -
 33
33 -
 34
34 -
 35
35 -
 36
36 -
 37
37 -
 38
38 -
 39
39 -
 40
40 -
 41
41 -
 42
42 -
 43
43 -
 44
44 -
 45
45 -
 46
46 -
 47
47 -
48
-
49
-
50
-
51
-
52
-
53
-
54
-
55
-
56
-
57
-
58
-
59
-
60
-
61
-
62
-
63
-
64
-
65
-
66
-
67
-
68
-
69
-
70
-
71
-
72
-
73
-
74
-
75
-
76
-
77
-
78
-
79
-
80
-
81
-
82
-
83
-
84
-
85
-
86
-
87
-
88
-
89
-
90
-
91
-
92
-
93
-
94
-
95
-
96
-
97
-
98
-
99
-
100
-
101
-
102
-
103
-
104
-
105
-
106
-
107
-
108
-
109
-
110
-
111
-
112
-
113
-
114
-
115
-
116
-
117
-
118
-
119
-
120
-
121
-
122
-
123
-
124
-
125
-
126
-
127
-
128
-
129
-
130
-
131
-
132
-
133
-
134
-
135
-
136
-
137
-
138
-
139
-
140
-
141
-
142
-
143
-
144
-
145
-
146
-
147
-
148
-
149
-
150
-
151
-
152
-
153
-
154
-
155
-
156
-
157
-
158
-
159
-
160
-
161
-
162
-
163
-
164
-
165
-
166
-
167
-
168
-
169
-
170
-
171
-
172
-
173
-
174
-
175
-
176
-
177
-
178
-
179
-
180
-
181
-
182
-
183
-
184
-
185
-
186
-
187
-
188
-
189
-
190
-
191
-
192
-
193
-
194
-
195
-
196
-
197
-
198
-
199
-
200
-
201
-
202
-
203
-
204
-
205
-
206
-
207
-
208
-
209
-
210
-
211
-
212
-
213
-
214
-
215
-
216
-
217
-
218
-
219
-
220
-
221
-
222
-
223
-
224
-
225
-
226
-
227
-
228
-
229
-
230
-
231
-
232
-
233
-
234
-
235
-
236
-
237
-
238
-
239
-
240
-
241
-
242
-
243
-
244
-
245
-
246
-
247
-
248
-
249
-
250
-
251
-
252
-
253
-
254
-
255
-
256
-
257
-
258
-
259
-
260
-
261
-
262
-
263
-
264
-
265
-
266
-
267
-
268
-
269
-
270
-
271
-
272
-
273
-
274
-
275
-
276
-
277
-
278
-
279
-
280
-
281
-
282
-
283
-
284
-
285
-
286
-
287
-
288
-
289
-
290
-
291
-
292
-
293
-
294
-
295
-
296
-
297
-
298
-
299
-
300
-
301
-
302
-
303
-
304
-
305
-
306
-
307
-
308
-
309
-
310
-
311
-
312
-
313
-
314
-
315
-
316
-
317
-
318
-
319
-
320
-
321
-
322
-
323
-
324
 |
 |

15
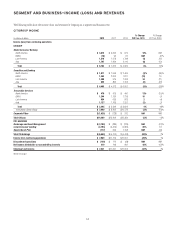
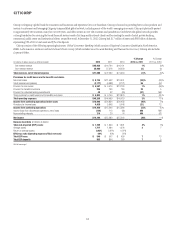
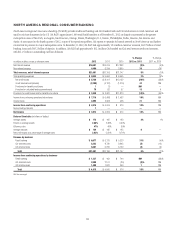
GLOBAL CONSUMER BANKING
Global Consumer Banking (GCB) consists of Citigroup’s four geographical Regional Consumer Banking (RCB) businesses that provide traditional banking
services to retail customers through retail banking, commercial banking, Citi-branded cards and Citi retail services. GCB is a globally diversified business with
4,008 branches in 39 countries around the world. For the year ended December 31, 2012, GCB had $387 billion of average assets and $322 billion of average
deposits. Citi’s strategy is to focus on the top 150 cities globally that it believes have the highest growth potential in consumer banking. Consistent with this
strategy, as announced in the fourth quarter of 2012 as part of its repositioning efforts, Citi intends to optimize its branch footprint and further concentrate its
presence in major metropolitan areas. As of December 31, 2012, Citi had consumer banking operations in approximately 120, or 80%, of these cities.
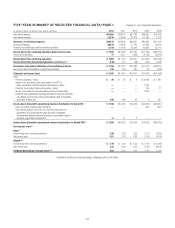
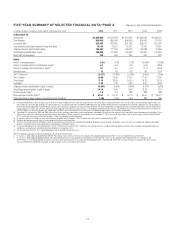
In millions of dollars except as otherwise noted 2012 2011 2010
% Change
2012 vs. 2011
% Change
2011 vs. 2010
Net interest revenue $29,468 $29,683 $ 29,858 (1)% (1)%
Non-interest revenue 10,746 9,512 9,511 13 —
Total revenues, net of interest expense $40,214 $39,195 $ 39,369 3% —%
Total operating expenses $21,819 $21,408 $ 18,887 2% 13%
Net credit losses $ 8,452 $10,840 $ 16,328 (22)% (34)%
Credit reserve build (release) (2,131) (4,429) (2,547) 52 (74)
Provisions for unfunded lending commitments —3 (3) (100) NM
Provision for benefits and claims 237 192 184 23 4
Provisions for credit losses and for benefits and claims $ 6,558 $ 6,606 $ 13,962 (1)% (53)%
Income from continuing operations before taxes $11,837 $11,181 $ 6,520 6% 71%
Income taxes 3,733 3,509 1,551 6NM
Income from continuing operations $ 8,104 $ 7,672 $ 4,969 6% 54%
Noncontrolling interests 3— (9) —100
Net income $ 8,101 $ 7,672 $ 4,978 6% 54%
Balance Sheet data (in billions of dollars)
Average assets $ 387 $ 376 $ 353 3% 7%
Return on assets 2.09% 2.04% 1.41%
Efficiency ratio 54% 55% 48%
Total EOP assets $ 402 $ 385 $ 374 43
Average deposits 322 314 299 35
Net credit losses as a percentage of average loans 2.95% 3.93% 6.22%
Revenue by business
Retail banking $18,059 $16,398 $ 15,874 10% 3%
Cards (1) 22,155 22,797 23,495 (3) (3)
Total $40,214 $39,195 $ 39,369 3% —%
Income from continuing operations by business
Retail banking $ 2,986 $ 2,523 $ 3,052 18% (17)%
Cards (1) 5,118 5,149 1,917 (1) NM
Total $ 8,104 $ 7,672 $ 4,969 6% 54%
Foreign Currency (FX) Translation Impact
Total revenue—as reported $40,214 $39,195 $ 39,369 3% —%
Impact of FX translation (2) —(742) (153)
Total revenues—ex-FX $40,214 $38,453 $ 39,216 5% (2)%
Total operating expenses—as reported $21,819 $21,408 $ 18,887 2% 13%
Impact of FX translation (2) —(494) (134)
Total operating expenses—ex-FX $21,819 $20,914 $ 18,753 4% 12%
Total provisions for LLR & PBC—as reported $ 6,558 $ 6,606 $ 13,962 (1)% (53)%
Impact of FX translation (2) —(167) (19)
Total provisions for LLR & PBC—ex-FX $ 6,558 $ 6,439 $ 13,943 2% (54)%
Net income—as reported $ 8,101 $ 7,672 $ 4,978 6% 54%
Impact of FX translation (2) —(102) (17)
Net income—ex-FX $ 8,101 $ 7,570 $ 4,961 7% 53%
(1) Includes both Citi-branded cards and Citi retail services.
(2) Reflects the impact of foreign exchange (FX) translation into U.S. dollars at the current exchange rate for all periods presented.
NM Not meaningful