Citibank 2012 Annual Report Download - page 111
Download and view the complete annual report
Please find page 111 of the 2012 Citibank annual report below. You can navigate through the pages in the report by either clicking on the pages listed below, or by using the keyword search tool below to find specific information within the annual report.-
 1
1 -
2
-
3
-
4
-
5
-
6
-
7
-
8
-
9
-
10
-
11
-
12
-
13
-
14
-
15
-
16
-
17
-
18
-
19
-
20
-
21
-
22
-
23
-
24
-
25
-
26
-
27
-
28
-
29
-
30
-
31
-
32
-
33
-
34
-
35
-
36
-
37
-
38
-
39
-
40
-
41
-
42
-
43
-
44
-
45
-
46
-
47
-
48
-
49
-
50
-
51
-
52
-
53
-
54
-
55
-
56
-
57
-
58
-
59
-
60
-
61
-
62
-
63
-
64
-
65
-
66
-
67
-
68
-
69
-
70
-
71
-
72
-
73
-
74
-
75
-
76
-
77
-
78
-
79
-
80
-
81
-
82
-
83
-
84
-
85
-
86
-
87
-
88
-
89
-
90
-
91
-
92
-
93
-
94
-
95
-
96
-
97
-
98
-
99
-
100
-
 101
101 -
 102
102 -
 103
103 -
 104
104 -
 105
105 -
 106
106 -
 107
107 -
 108
108 -
 109
109 -
 110
110 -
 111
111 -
 112
112 -
 113
113 -
 114
114 -
 115
115 -
 116
116 -
 117
117 -
 118
118 -
 119
119 -
 120
120 -
 121
121 -
122
-
123
-
124
-
125
-
126
-
127
-
128
-
129
-
130
-
131
-
132
-
133
-
134
-
135
-
136
-
137
-
138
-
139
-
140
-
141
-
142
-
143
-
144
-
145
-
146
-
147
-
148
-
149
-
150
-
151
-
152
-
153
-
154
-
155
-
156
-
157
-
158
-
159
-
160
-
161
-
162
-
163
-
164
-
165
-
166
-
167
-
168
-
169
-
170
-
171
-
172
-
173
-
174
-
175
-
176
-
177
-
178
-
179
-
180
-
181
-
182
-
183
-
184
-
185
-
186
-
187
-
188
-
189
-
190
-
191
-
192
-
193
-
194
-
195
-
196
-
197
-
198
-
199
-
200
-
201
-
202
-
203
-
204
-
205
-
206
-
207
-
208
-
209
-
210
-
211
-
212
-
213
-
214
-
215
-
216
-
217
-
218
-
219
-
220
-
221
-
222
-
223
-
224
-
225
-
226
-
227
-
228
-
229
-
230
-
231
-
232
-
233
-
234
-
235
-
236
-
237
-
238
-
239
-
240
-
241
-
242
-
243
-
244
-
245
-
246
-
247
-
248
-
249
-
250
-
251
-
252
-
253
-
254
-
255
-
256
-
257
-
258
-
259
-
260
-
261
-
262
-
263
-
264
-
265
-
266
-
267
-
268
-
269
-
270
-
271
-
272
-
273
-
274
-
275
-
276
-
277
-
278
-
279
-
280
-
281
-
282
-
283
-
284
-
285
-
286
-
287
-
288
-
289
-
290
-
291
-
292
-
293
-
294
-
295
-
296
-
297
-
298
-
299
-
300
-
301
-
302
-
303
-
304
-
305
-
306
-
307
-
308
-
309
-
310
-
311
-
312
-
313
-
314
-
315
-
316
-
317
-
318
-
319
-
320
-
321
-
322
-
323
-
324
 |
 |
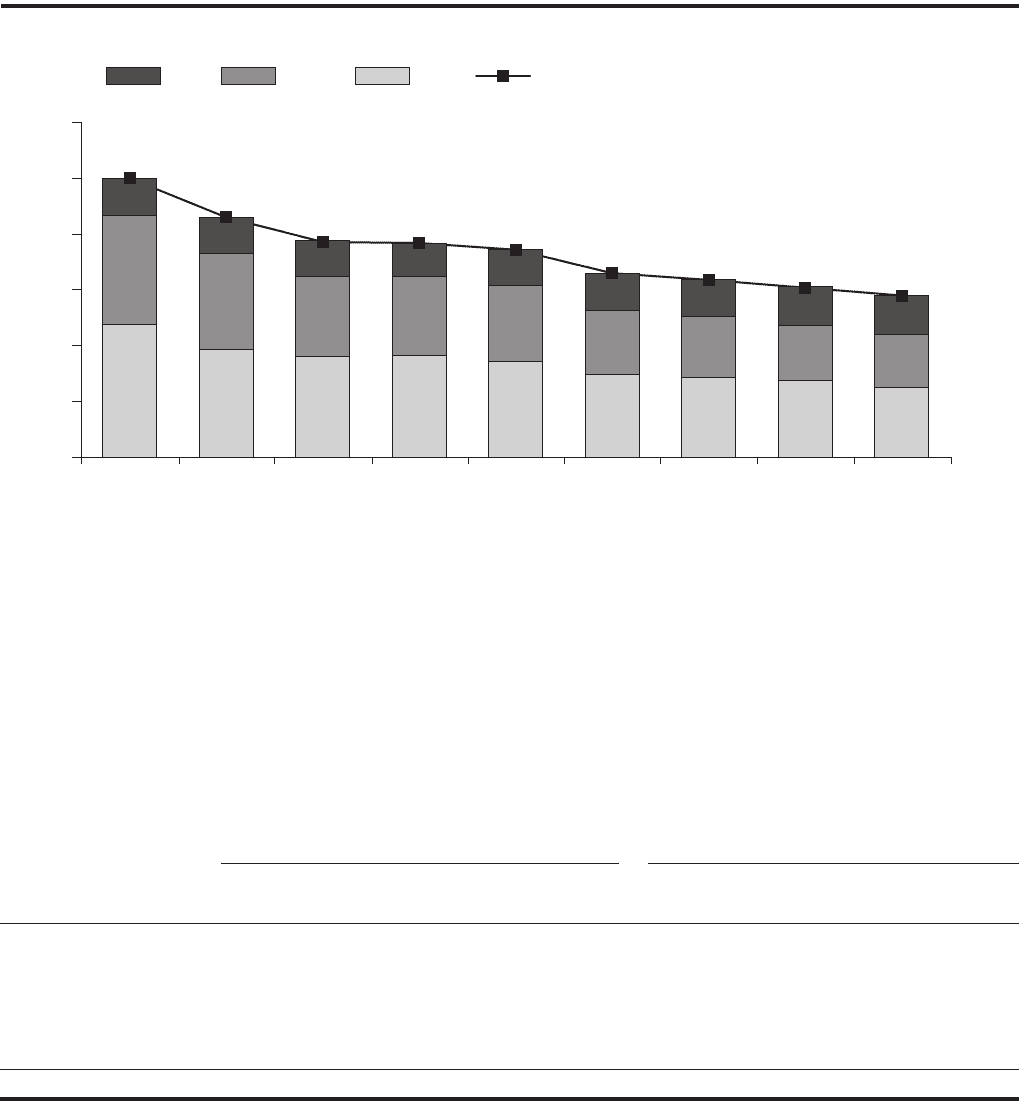
89
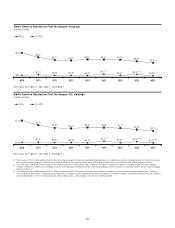
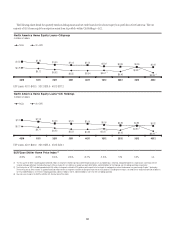
North America Home Equity Loan Delinquencies—Citi Holdings
In billions of dollars
Days Past Due:
0.0
0.5
1.0
1.5
2.0
2.5
3.0
30+ DPD180+ 90-179 30-89
4Q123Q122Q121Q124Q113Q112Q111Q114Q10
1.19 0.97 0.90 0.91 0.86 0.74 0.72 0.69 0.63
0.98
0.86 0.72 0.71 0.68 0.58 0.54 0.49 0.47
0.33
0.32
0.32 0.30 0.32
0.33 0.33 0.35
0.35
2.50
2.15
1.93 1.92 1.86
1.65 1.59 1.52 1.45
Note: For each of the tables above, days past due exclude (i) U.S. mortgage loans that are guaranteed by U.S. government-sponsored agencies, because the potential loss predominantly resides with the U.S. agencies, and
(ii) loans recorded at fair value. Totals may not sum due to rounding.
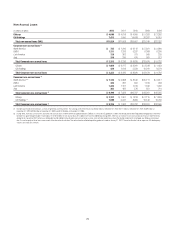
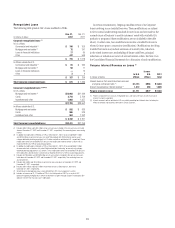
As evidenced by the tables above, home equity loan delinquencies
improved during 2012, although the rate of improvement has slowed.
Given the lack of a market in which to sell delinquent home equity loans,
as well as the relatively smaller number of home equity loan modifications
and modification programs (see Note 16 to the Consolidated Financial
Statements), Citi’s ability to offset increased delinquencies and net credit
losses in its home equity loan portfolio in Citi Holdings, whether pursuant
to deterioration of the underlying credit performance of these loans or
otherwise, is more limited as compared to residential first mortgages as
discussed above. Accordingly, Citi could begin to experience increased
delinquencies and thus increased net credit losses in this portfolio going
forward. Citi has taken these trends and uncertainties into consideration
in determining its loan loss reserves. See “North America Consumer
Mortgages—Loan Loss Reserve Coverage” below.
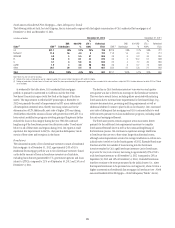
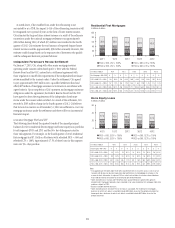
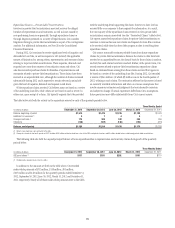
North America Home Equity Loans—State Delinquency Trends
The following tables set forth, for total Citigroup, the six states and/or regions with the highest concentration of Citi’s home equity loans as of December 31,
2012 and December 31, 2011.
In billions of dollars December 31, 2012 December 31, 2011
State (1) ENR (2)
ENR
Distribution
90+DPD
%
%
CLTV >
100% (3)
Refreshed
FICO ENR (2)
ENR
Distribution
90+DPD
%
%
CLTV >
100% (3)
Refreshed
FICO
CA $ 9.7 28% 2.0% 40% 723 $11.2 27% 2.3% 50% 721
NY/NJ/CT 8.2 23 2.3 20 715 9.2 22 2.1 19 715
FL 2.4 7 3.4 58 698 2.8 7 3.3 69 698
IL 1.4 4 2.1 55 708 1.6 4 2.3 62 705
IN/OH/MI 1.2 3 2.2 55 679 1.5 4 2.6 66 678
AZ/NV 0.8 2 3.1 70 709 1.0 3 4.1 83 706
Other 11.5 33 2.2 37 695 13.7 33 2.3 46 695
Total $35.2 100% 2.3% 37% 704 $41.0 100% 2.4% 45% 707
Note: Totals may not sum due to rounding.
(1) Certain of the states are included as part of a region based on Citi’s view of similar home prices (HPI) within the region.
(2) Ending net receivables. Excludes loans in Canada and Puerto Rico and loans subject to LTSCs. Excludes balances for which FICO or LTV data are unavailable.
(3) Represents combined loan-to-value (CLTV) for both residential first mortgages and home equity loans.