Citibank 2009 Annual Report Download - page 97
Download and view the complete annual report
Please find page 97 of the 2009 Citibank annual report below. You can navigate through the pages in the report by either clicking on the pages listed below, or by using the keyword search tool below to find specific information within the annual report.-
 1
1 -
2
-
3
-
4
-
5
-
6
-
7
-
8
-
9
-
10
-
11
-
12
-
13
-
14
-
15
-
16
-
17
-
18
-
19
-
20
-
21
-
22
-
23
-
24
-
25
-
26
-
27
-
28
-
29
-
30
-
31
-
32
-
33
-
34
-
35
-
36
-
37
-
38
-
39
-
40
-
41
-
42
-
43
-
44
-
45
-
46
-
47
-
48
-
49
-
50
-
51
-
52
-
53
-
54
-
55
-
56
-
57
-
58
-
59
-
60
-
61
-
62
-
63
-
64
-
65
-
66
-
67
-
68
-
69
-
70
-
71
-
72
-
73
-
74
-
75
-
76
-
77
-
78
-
79
-
80
-
81
-
82
-
83
-
84
-
85
-
86
-
 87
87 -
 88
88 -
 89
89 -
 90
90 -
 91
91 -
 92
92 -
 93
93 -
 94
94 -
 95
95 -
 96
96 -
 97
97 -
 98
98 -
 99
99 -
 100
100 -
 101
101 -
 102
102 -
 103
103 -
 104
104 -
 105
105 -
 106
106 -
 107
107 -
108
-
109
-
110
-
111
-
112
-
113
-
114
-
115
-
116
-
117
-
118
-
119
-
120
-
121
-
122
-
123
-
124
-
125
-
126
-
127
-
128
-
129
-
130
-
131
-
132
-
133
-
134
-
135
-
136
-
137
-
138
-
139
-
140
-
141
-
142
-
143
-
144
-
145
-
146
-
147
-
148
-
149
-
150
-
151
-
152
-
153
-
154
-
155
-
156
-
157
-
158
-
159
-
160
-
161
-
162
-
163
-
164
-
165
-
166
-
167
-
168
-
169
-
170
-
171
-
172
-
173
-
174
-
175
-
176
-
177
-
178
-
179
-
180
-
181
-
182
-
183
-
184
-
185
-
186
-
187
-
188
-
189
-
190
-
191
-
192
-
193
-
194
-
195
-
196
-
197
-
198
-
199
-
200
-
201
-
202
-
203
-
204
-
205
-
206
-
207
-
208
-
209
-
210
-
211
-
212
-
213
-
214
-
215
-
216
-
217
-
218
-
219
-
220
-
221
-
222
-
223
-
224
-
225
-
226
-
227
-
228
-
229
-
230
-
231
-
232
-
233
-
234
-
235
-
236
-
237
-
238
-
239
-
240
-
241
-
242
-
243
-
244
-
245
-
246
-
247
-
248
-
249
-
250
-
251
-
252
-
253
-
254
-
255
-
256
-
257
-
258
-
259
-
260
-
261
-
262
-
263
-
264
-
265
-
266
-
267
-
268
-
269
-
270
-
271
-
272
-
273
-
274
-
275
-
276
-
277
-
278
-
279
-
280
-
281
-
282
-
283
-
284
 |
 |

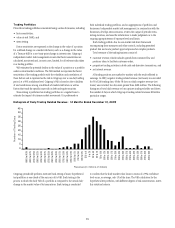
87
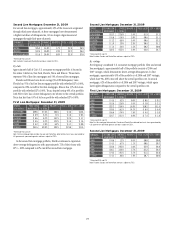
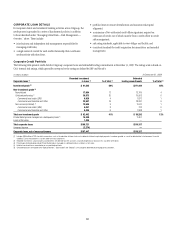
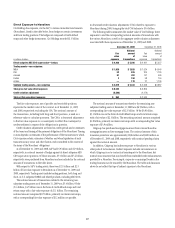
Direct Exposure to Monolines
Citi Holdings has exposure, via the SAP, to various monoline bond insurers
(Monolines), listed in the table below, from hedges on certain investments
and from trading positions. The hedges are composed of credit default
swaps and other hedge instruments. Citi Holdings recorded $1.3 billion
in downward credit valuation adjustments (CVA) related to exposure to
Monolines during 2009, bringing the total CVA balance to $5.6 billion.
The following table summarizes the market value of Citi Holdings’ direct
exposures to and the corresponding notional amounts of transactions with
the various Monolines, as well as the aggregate credit valuation adjustment
associated with these exposures as of December 31, 2009 and 2008.
December 31, 2009 December 31, 2008
In millions of dollars
Fair
value
exposure
Notional
amount
of
transactions
Fair
value
exposure
Notional
amount
of
transactions
Direct subprime ABS CDO super senior—Ambac $ 4,468 $ 5,295 $ 4,461 $ 5,357
Trading assets—non-subprime:
MBIA $ 1,939 $ 3,828 $ 1,924 $ 4,040
FSA 52 835 204 1,126
Assured 81 452 141 465
Radian 3 150 58 150
Ambac — 178 21 1,106
Subtotal trading assets—non-subprime $ 2,075 $ 5,443 $ 2,348 $ 6,887
Total gross fair value direct exposure $ 6,543 $ 6,809
Credit valuation adjustment (5,580) (4,279)
Total net fair value direct exposure $ 963 $ 2,530
The fair value exposure, net of payable and receivable positions,
represents the market value of the contract as of December 31, 2009
and 2008, respectively, excluding the CVA. The notional amount of
the transactions, including both long and short positions, is used as a
reference value to calculate payments. The CVA is a downward adjustment
to the fair value exposure to a counterparty to reflect the counterparty’s
creditworthiness in respect of the obligations in question.
Credit valuation adjustments are based on credit spreads and on estimates
of the terms and timing of the payment obligations of the Monolines. Timing
in turn depends on estimates of the performance of the transactions to which
Citi’s exposure relates, estimates of whether and when liquidation of such
transactions may occur and other factors, each considered in the context of
the terms of the Monolines’ obligations.
As of December 31, 2009 and 2008, SAP had $5.9 billion and $6.9 billion,
respectively, in notional amount of hedges against its direct subprime ABS
CDO super-senior positions. Of those amounts, $5.3 billion and $5.4 billion,
respectively, were purchased from Monolines and are included in the notional
amount of transactions in the table above.
With respect to SAP’s trading assets, there were $2.1 billion and $2.3
billion of fair value exposure to Monolines as of December 31, 2009 and
2008, respectively. Trading assets include trading positions, both long and
short, in U.S. subprime RMBS and related products, including ABS CDOs.
The notional amount of transactions related to the remaining non-
subprime trading assets as of December 31, 2009 was $5.4 billion. Of the
$5.4 billion, $4.7 billion was in the form of credit default swaps and total
return swaps with a fair value exposure of $2.1 billion. The remaining
notional amount comprised $0.7 billion, primarily in interest-rate swaps,
with a corresponding fair value exposure of $12 million net payable.
The notional amount of transactions related to the remaining non-
subprime trading assets at December 31, 2008 was $6.9 billion, with a
corresponding fair value exposure of $2.3 billion. Of the $6.9 billion,
$5.1 billion was in the form of credit default swaps and total return swaps
with a fair value of $2.3 billion. The remaining notional amount comprised
$1.8 billion, primarily in interest-rate swaps with a corresponding fair value
exposure of $3.9 million.
Citigroup has purchased mortgage insurance from various Monoline
mortgage insurers on first-mortgage loans. The notional amount of this
insurance protection was approximately $230 million and $400 million as
of December 31, 2009 and 2008, respectively, with nominal pending claims
against this notional amount.
In addition, Citigroup has indirect exposure to Monolines in various
other parts of its businesses. Indirect exposure includes circumstances in
which Citigroup is not a contractual counterparty to the Monolines, but
instead owns securities that may benefit from embedded credit enhancements
provided by a Monoline. For example, corporate or municipal bonds in the
trading business may be insured by the Monolines. The table and discussion
above do not reflect this type of indirect exposure to the Monolines.