Citibank 2009 Annual Report Download - page 87
Download and view the complete annual report
Please find page 87 of the 2009 Citibank annual report below. You can navigate through the pages in the report by either clicking on the pages listed below, or by using the keyword search tool below to find specific information within the annual report.-
 1
1 -
2
-
3
-
4
-
5
-
6
-
7
-
8
-
9
-
10
-
11
-
12
-
13
-
14
-
15
-
16
-
17
-
18
-
19
-
20
-
21
-
22
-
23
-
24
-
25
-
26
-
27
-
28
-
29
-
30
-
31
-
32
-
33
-
34
-
35
-
36
-
37
-
38
-
39
-
40
-
41
-
42
-
43
-
44
-
45
-
46
-
47
-
48
-
49
-
50
-
51
-
52
-
53
-
54
-
55
-
56
-
57
-
58
-
59
-
60
-
61
-
62
-
63
-
64
-
65
-
66
-
67
-
68
-
69
-
70
-
71
-
72
-
73
-
74
-
75
-
76
-
 77
77 -
 78
78 -
 79
79 -
 80
80 -
 81
81 -
 82
82 -
 83
83 -
 84
84 -
 85
85 -
 86
86 -
 87
87 -
 88
88 -
 89
89 -
 90
90 -
 91
91 -
 92
92 -
 93
93 -
 94
94 -
 95
95 -
 96
96 -
 97
97 -
98
-
99
-
100
-
101
-
102
-
103
-
104
-
105
-
106
-
107
-
108
-
109
-
110
-
111
-
112
-
113
-
114
-
115
-
116
-
117
-
118
-
119
-
120
-
121
-
122
-
123
-
124
-
125
-
126
-
127
-
128
-
129
-
130
-
131
-
132
-
133
-
134
-
135
-
136
-
137
-
138
-
139
-
140
-
141
-
142
-
143
-
144
-
145
-
146
-
147
-
148
-
149
-
150
-
151
-
152
-
153
-
154
-
155
-
156
-
157
-
158
-
159
-
160
-
161
-
162
-
163
-
164
-
165
-
166
-
167
-
168
-
169
-
170
-
171
-
172
-
173
-
174
-
175
-
176
-
177
-
178
-
179
-
180
-
181
-
182
-
183
-
184
-
185
-
186
-
187
-
188
-
189
-
190
-
191
-
192
-
193
-
194
-
195
-
196
-
197
-
198
-
199
-
200
-
201
-
202
-
203
-
204
-
205
-
206
-
207
-
208
-
209
-
210
-
211
-
212
-
213
-
214
-
215
-
216
-
217
-
218
-
219
-
220
-
221
-
222
-
223
-
224
-
225
-
226
-
227
-
228
-
229
-
230
-
231
-
232
-
233
-
234
-
235
-
236
-
237
-
238
-
239
-
240
-
241
-
242
-
243
-
244
-
245
-
246
-
247
-
248
-
249
-
250
-
251
-
252
-
253
-
254
-
255
-
256
-
257
-
258
-
259
-
260
-
261
-
262
-
263
-
264
-
265
-
266
-
267
-
268
-
269
-
270
-
271
-
272
-
273
-
274
-
275
-
276
-
277
-
278
-
279
-
280
-
281
-
282
-
283
-
284
 |
 |

77
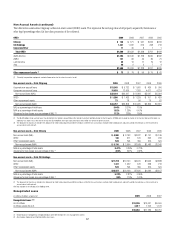
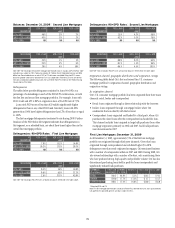
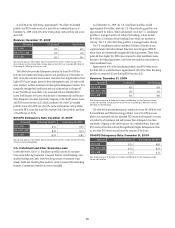
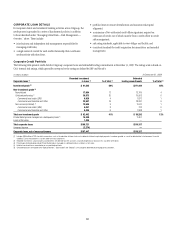
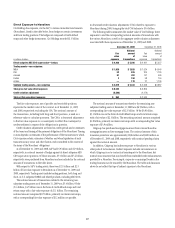
Second Lien Mortgages: December 31, 2009
For second lien mortgages, approximately 49% of the loans were originated
through third-party channels. As these mortgages have demonstrated
a higher incidence of delinquencies, Citi no longer originates second
mortgages through third-party channels.
CHANNELS
($ in billions)
SECOND LIEN
MORTGAGES
CHANNEL
% TOTAL
90+DPD% *FICO < 620 *LTV > 100%
RETAIL $25.2 51.0% 1.7% $3.9 $6.9
BROKER $12.4 25.0% 3.9% $2.2 $6.8
CORRESPONDENT $11.8 24.0% 5.0% $2.9 $7.0
* Refreshed FICO and LTV.
Note: Excludes Canada and Puerto Rico and loans subject to LTSCs.
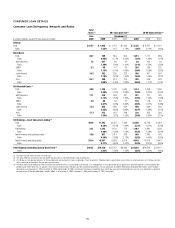
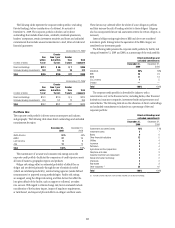
By state
Approximately half of Citi’s U.S. consumer mortgage portfolio is located in
five states: California, New York, Florida, Texas and Illinois. Those states
represent 50% of first lien mortgages and 54% of second lien mortgages.
Florida and Illinois have above-average 90+DPD delinquency rates.
Florida has 55% of its first lien mortgage portfolio with refreshed LTV>100%,
compared to 28% overall for first lien mortgages. Illinois has 35% of its loan
portfolio with refreshed LTV>100%. Texas, despite having 40% of its portfolio
with FICO<620, has a lower delinquency rate relative to the overall portfolio.
Texas has less than 0.5% of its loan portfolio with refreshed LTV>100%.
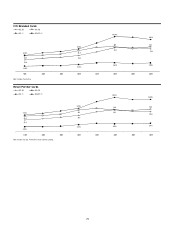
First Lien Mortgages: December 31, 2009
STATES
($ in billions)
FIRST LIEN
MORTGAGES
STATE
% TOTAL
90+DPD % *FICO < 620 *LTV > 100%
CALIFORNIA $29.6 27.6% 10.4% $ 4.8 $12.6
NEW YORK $ 8.9 8.3% 7.1% $ 1.6 $ 0.5
FLORIDA $ 6.6 6.2% 18.1% $ 2.5 $ 3.7
ILLINOIS $ 4.5 4.2% 12.3% $ 1.5 $ 1.6
TEXAS $ 4.2 3.9% 6.2% $ 1.7 $ 0.0
OTHERS $53.5 49.9% 10.4% $19.8 $11.5
* Refreshed FICO and LTV.
Note: First lien mortgage table excludes Canada and Puerto Rico, deferred fees/costs, loans guaranteed by
U.S. government sponsored agencies and loans subject to LTSCs.
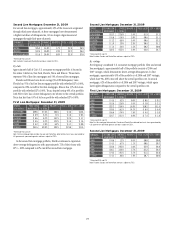
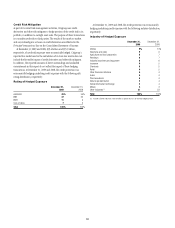
In the second lien mortgage portfolio, Florida continues to experience
above-average delinquencies, with approximately 72% of their loans with
LTV > 100% compared to 42% overall for second lien mortgages.
Second Lien Mortgages: December 31, 2009
STATES
($ in billions)
SECOND LIEN
MORTGAGES
STATE
% TOTAL
90+DPD % *FICO < 620 *LTV > 100%
CALIFORNIA $13.7 27.8% 3.4% $1.9 $7.3
NEW YORK $ 6.6 13.4% 2.0% $0.8 $1.1
FLORIDA $ 3.2 6.6% 5.4% $0.8 $2.3
ILLINOIS $ 1.9 3.9% 2.9% $0.4 $1.1
TEXAS $ 1.4 2.8% 1.5% $0.2 $0.0
OTHERS $22.5 45.5% 2.9% $4.8 $8.7
* Refreshed FICO and LTV.
Note: Excludes Canada and Puerto Rico and loans subject to LTSCs.
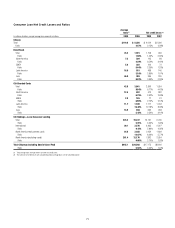
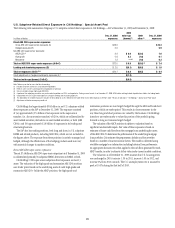
By vintage
For Citigroup’s combined U.S. consumer mortgage portfolio (first and second
lien mortgages), approximately half of the portfolio consists of 2006 and
2007 vintages, which demonstrate above-average delinquencies. In first
mortgages, approximately 43% of the portfolio is of 2006 and 2007 vintages,
which have 90+DPD rates well above the overall portfolio rate. In second
mortgages, 62% of the portfolio is of 2006 and 2007 vintages, which again
have higher delinquencies compared to the overall portfolio rate.
First Lien Mortgages: December 31, 2009
VINTAGES
($ in billions)
FIRST LIEN
MORTGAGES
VINTAGE
% TOTAL
90+DPD % *FICO < 620 *LTV > 100%
2009 $ 4.5 4.2% 0.6% $ 0.6 $ 0.1
2008 $13.8 12.8% 5.5% $ 3.0 $ 2.1
2007 $27.2 25.4% 16.9% $10.2 $11.5
2006 $19.5 18.1% 14.3% $ 6.4 $ 8.4
2005 $18.6 17.4% 7.8% $ 4.4 $ 5.9
≤ 2004 $23.7 22.1% 6.9% $ 7.4 $ 1.8
* Refreshed FICO and LTV.
Note: First lien mortgage table excludes Canada and Puerto Rico, deferred fees/costs, loans guaranteed by
U.S. government sponsored agencies and loans subject to LTSCs.
Second Lien Mortgages: December 31, 2009
VINTAGES
($ in billions)
SECOND LIEN
MORTGAGES
VINTAGE
% TOTAL
90+DPD % *FICO < 620 *LTV > 100%
2009 $ 0.6 1.2% 0.5% $0.0 $0.0
2008 $ 4.3 8.7% 1.1% $0.6 $0.7
2007 $14.6 29.5% 3.6% $2.9 $6.8
2006 $16.1 32.6% 3.7% $3.2 $8.4
2005 $ 9.5 19.3% 2.7% $1.5 $4.0
≤ 2004 $ 4.3 8.6% 1.9% $0.7 $0.6
* Refreshed FICO and LTV.
Note: Excludes Canada and Puerto Rico and loans subject to LTSCs.