Citibank 2009 Annual Report Download - page 233
Download and view the complete annual report
Please find page 233 of the 2009 Citibank annual report below. You can navigate through the pages in the report by either clicking on the pages listed below, or by using the keyword search tool below to find specific information within the annual report.-
 1
1 -
2
-
3
-
4
-
5
-
6
-
7
-
8
-
9
-
10
-
11
-
12
-
13
-
14
-
15
-
16
-
17
-
18
-
19
-
20
-
21
-
22
-
23
-
24
-
25
-
26
-
27
-
28
-
29
-
30
-
31
-
32
-
33
-
34
-
35
-
36
-
37
-
38
-
39
-
40
-
41
-
42
-
43
-
44
-
45
-
46
-
47
-
48
-
49
-
50
-
51
-
52
-
53
-
54
-
55
-
56
-
57
-
58
-
59
-
60
-
61
-
62
-
63
-
64
-
65
-
66
-
67
-
68
-
69
-
70
-
71
-
72
-
73
-
74
-
75
-
76
-
77
-
78
-
79
-
80
-
81
-
82
-
83
-
84
-
85
-
86
-
87
-
88
-
89
-
90
-
91
-
92
-
93
-
94
-
95
-
96
-
97
-
98
-
99
-
100
-
101
-
102
-
103
-
104
-
105
-
106
-
107
-
108
-
109
-
110
-
111
-
112
-
113
-
114
-
115
-
116
-
117
-
118
-
119
-
120
-
121
-
122
-
123
-
124
-
125
-
126
-
127
-
128
-
129
-
130
-
131
-
132
-
133
-
134
-
135
-
136
-
137
-
138
-
139
-
140
-
141
-
142
-
143
-
144
-
145
-
146
-
147
-
148
-
149
-
150
-
151
-
152
-
153
-
154
-
155
-
156
-
157
-
158
-
159
-
160
-
161
-
162
-
163
-
164
-
165
-
166
-
167
-
168
-
169
-
170
-
171
-
172
-
173
-
174
-
175
-
176
-
177
-
178
-
179
-
180
-
181
-
182
-
183
-
184
-
185
-
186
-
187
-
188
-
189
-
190
-
191
-
192
-
193
-
194
-
195
-
196
-
197
-
198
-
199
-
200
-
201
-
202
-
203
-
204
-
205
-
206
-
207
-
208
-
209
-
210
-
211
-
212
-
213
-
214
-
215
-
216
-
217
-
218
-
219
-
220
-
221
-
222
-
 223
223 -
 224
224 -
 225
225 -
 226
226 -
 227
227 -
 228
228 -
 229
229 -
 230
230 -
 231
231 -
 232
232 -
 233
233 -
 234
234 -
 235
235 -
 236
236 -
 237
237 -
 238
238 -
 239
239 -
 240
240 -
 241
241 -
 242
242 -
 243
243 -
244
-
245
-
246
-
247
-
248
-
249
-
250
-
251
-
252
-
253
-
254
-
255
-
256
-
257
-
258
-
259
-
260
-
261
-
262
-
263
-
264
-
265
-
266
-
267
-
268
-
269
-
270
-
271
-
272
-
273
-
274
-
275
-
276
-
277
-
278
-
279
-
280
-
281
-
282
-
283
-
284
 |
 |
223
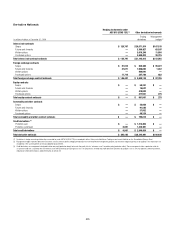
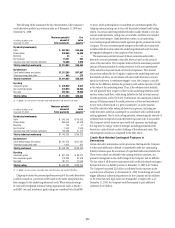
25. CONCENTRATIONS OF CREDIT RISK
Concentrations of credit risk exist when changes in economic, industry or
geographic factors similarly affect groups of counterparties whose aggregate
credit exposure is material in relation to Citigroup’s total credit exposure.
Although Citigroup’s portfolio of financial instruments is broadly diversified
along industry, product, and geographic lines, material transactions are
completed with other financial institutions, particularly in the securities
trading, derivatives, and foreign exchange businesses.
In connection with the Company’s efforts to maintain a diversified
portfolio, the Company limits its exposure to any one geographic region,
country or individual creditor and monitors this exposure on a continuous
basis. At December 31, 2009, Citigroup’s most significant concentration of
credit risk was with the U.S. government and its agencies. The Company’s
exposure, which primarily results from trading assets and investments
issued by the U.S. government and its agencies, amounted to $126.6
billion and $93.7 billion at December 31, 2009 and 2008, respectively. The
Mexican and Japanese governments and their agencies are the next largest
exposures, which are rated investment grade by both Moody’s and S&P. The
Company’s exposure to Mexico amounted to $41.4 billion and $35.0 billion
at December 31, 2009 and 2008, respectively, and is composed of investment
securities, loans and trading assets. The Company’s exposure to Japan
amounted to $31.8 billion and $29.1 billion at December 31, 2009 and 2008,
respectively, and is composed of investment securities, loans and trading
assets.
26. FAIR VALUE MEASUREMENT
Effective January 1, 2007, the Company adopted SFAS 157 (now ASC
820-10), which defines fair value, establishes a consistent framework for
measuring fair value and expands disclosure requirements about fair value
measurements. Among other things, the standard requires the Company to
maximize the use of observable inputs and minimize the use of unobservable
inputs when measuring fair value. In addition, it precludes the use of
block discounts when measuring the fair value of instruments traded in an
active market; such discounts were previously applied to large holdings of
publicly traded equity securities. It also requires recognition of trade-date
gains related to certain derivative transactions whose fair value has been
determined using unobservable market inputs. This guidance supersedes the
guidance in Emerging Issues Task Force Issue No. 02-3, “Issues Involved in
Accounting for Derivative Contracts Held for Trading Purposes and Contracts
Involved in Energy Trading and Risk Management Activities” (EITF
Issue 02-3), which prohibited the recognition of trade-date gains for such
derivative transactions when determining the fair value of instruments not
traded in an active market.
As a result of the adoption of the standard, the Company made
amendments to the techniques used in measuring the fair value of derivative
and other positions. These amendments change the way that the probability
of default of a counterparty is factored into the valuation of derivative
positions, include for the first time the impact of Citigroup’s own credit risk
on derivatives and other liabilities measured at fair value, and also eliminate
the portfolio servicing adjustment that is no longer necessary.
Fair Value Hierarchy
ASC 820-10 also specifies a hierarchy of valuation techniques based
on whether the inputs to those valuation techniques are observable
or unobservable. Observable inputs reflect market data obtained from
independent sources, while unobservable inputs reflect the Company’s
market assumptions. These two types of inputs have created the following
fair-value hierarchy:
Level 1• : Quoted prices for identical instruments in active markets.
Level 2• : Quoted prices for similar instruments in active markets; quoted
prices for identical or similar instruments in markets that are not
active; and model-derived valuations in which all significant inputs and
significant value drivers are observable in active markets.
Level 3• : Valuations derived from valuation techniques in which one or
more significant inputs or significant value drivers are unobservable.
This hierarchy requires the use of observable market data when available.
The Company considers relevant and observable market prices in its
valuations where possible. The frequency of transactions, the size of the bid-
ask spread and the amount of adjustment necessary when comparing similar
transactions are all factors in determining the liquidity of markets and the
relevance of observed prices in those markets.