Citibank 2009 Annual Report Download - page 167
Download and view the complete annual report
Please find page 167 of the 2009 Citibank annual report below. You can navigate through the pages in the report by either clicking on the pages listed below, or by using the keyword search tool below to find specific information within the annual report.-
 1
1 -
2
-
3
-
4
-
5
-
6
-
7
-
8
-
9
-
10
-
11
-
12
-
13
-
14
-
15
-
16
-
17
-
18
-
19
-
20
-
21
-
22
-
23
-
24
-
25
-
26
-
27
-
28
-
29
-
30
-
31
-
32
-
33
-
34
-
35
-
36
-
37
-
38
-
39
-
40
-
41
-
42
-
43
-
44
-
45
-
46
-
47
-
48
-
49
-
50
-
51
-
52
-
53
-
54
-
55
-
56
-
57
-
58
-
59
-
60
-
61
-
62
-
63
-
64
-
65
-
66
-
67
-
68
-
69
-
70
-
71
-
72
-
73
-
74
-
75
-
76
-
77
-
78
-
79
-
80
-
81
-
82
-
83
-
84
-
85
-
86
-
87
-
88
-
89
-
90
-
91
-
92
-
93
-
94
-
95
-
96
-
97
-
98
-
99
-
100
-
101
-
102
-
103
-
104
-
105
-
106
-
107
-
108
-
109
-
110
-
111
-
112
-
113
-
114
-
115
-
116
-
117
-
118
-
119
-
120
-
121
-
122
-
123
-
124
-
125
-
126
-
127
-
128
-
129
-
130
-
131
-
132
-
133
-
134
-
135
-
136
-
137
-
138
-
139
-
140
-
141
-
142
-
143
-
144
-
145
-
146
-
147
-
148
-
149
-
150
-
151
-
152
-
153
-
154
-
155
-
156
-
 157
157 -
 158
158 -
 159
159 -
 160
160 -
 161
161 -
 162
162 -
 163
163 -
 164
164 -
 165
165 -
 166
166 -
 167
167 -
 168
168 -
 169
169 -
 170
170 -
 171
171 -
 172
172 -
 173
173 -
 174
174 -
 175
175 -
 176
176 -
 177
177 -
178
-
179
-
180
-
181
-
182
-
183
-
184
-
185
-
186
-
187
-
188
-
189
-
190
-
191
-
192
-
193
-
194
-
195
-
196
-
197
-
198
-
199
-
200
-
201
-
202
-
203
-
204
-
205
-
206
-
207
-
208
-
209
-
210
-
211
-
212
-
213
-
214
-
215
-
216
-
217
-
218
-
219
-
220
-
221
-
222
-
223
-
224
-
225
-
226
-
227
-
228
-
229
-
230
-
231
-
232
-
233
-
234
-
235
-
236
-
237
-
238
-
239
-
240
-
241
-
242
-
243
-
244
-
245
-
246
-
247
-
248
-
249
-
250
-
251
-
252
-
253
-
254
-
255
-
256
-
257
-
258
-
259
-
260
-
261
-
262
-
263
-
264
-
265
-
266
-
267
-
268
-
269
-
270
-
271
-
272
-
273
-
274
-
275
-
276
-
277
-
278
-
279
-
280
-
281
-
282
-
283
-
284
 |
 |

157
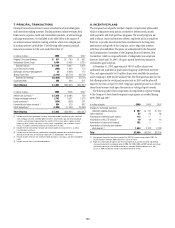
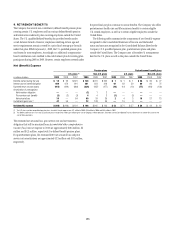
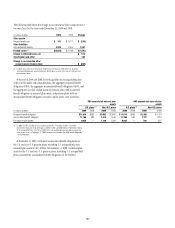
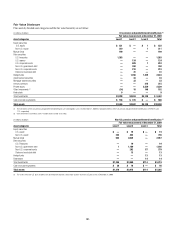
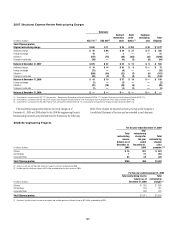
The following table shows the change in Accumulated other comprehensive
income (loss) for the years ended December 31, 2009 and 2008:
In millions of dollars 2009 2008 Change
Other assets
Prepaid benefit cost $ 741 $ 1,017 $ (276)
Other liabilities
Accrued benefit liability 3,576 2,309 1,267
Funded status (1) $(2,835) $ (1,292) $(1,543)
Change in deferred taxes, net $ 513
Amortization and other 184
Change in accumulated other
comprehensive income (loss) $ (846)
(1) Funded status consists of Net amount recognized on the balance sheet of the U.S. qualified
and nonqualified pension and postretirement benefit plans, as well as the non-U.S. pension and
postretirement plans.
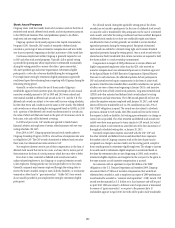
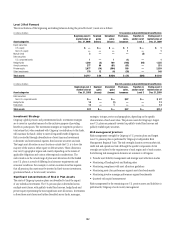
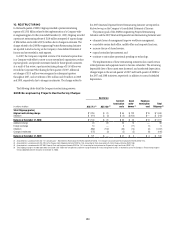
PBO exceeds fair value of plan
assets
ABO exceeds fair value of plan
assets
U.S. plans (1) Non-U.S. plans U.S. plans (1) Non-U.S. plans
In millions of dollars 2009 2008 2009 2008 2009 2008 2009 2008
Projected benefit obligation $11,815 $586 $1,662 $1,866 $ 11,815 $586 $1,288 $1,374
Accumulated benefit obligation 11,765 580 1,414 1,640 11,765 580 1,127 1,231
Fair value of plan assets 9,934 —1,169 1,328 9,934 —842 875
(1) In 2009, the PBO and ABO of the U.S. plans include $11,178 million and $11,129 million,
respectively, relating to the qualified plan and $637 million and $636 million, respectively, relating
to the nonqualified plans. The PBO and ABO of the U.S. qualified pension plan did not exceed fair
value of plan assets at December 31, 2008 and were not included in the 2008 benefit obligations
summarized above.
At the end of 2009 and 2008, for both qualified and nonqualified plans
and for both funded and unfunded plans, the aggregate projected benefit
obligation (PBO), the aggregate accumulated benefit obligation (ABO), and
the aggregate fair value of plan assets for pension plans with a projected
benefit obligation in excess of plan assets, and pension plans with an
accumulated benefit obligation in excess of plan assets, were as follows:
At December 31, 2009, combined accumulated benefit obligations for
the U.S. and non-U.S. pension plans, excluding U.S. nonqualified plans,
exceeded plan assets by $0.5 billion. At December 31, 2008, combined plan
assets for the U.S. and non-U.S. pension plans, excluding U.S. nonqualified
plans, exceeded the accumulated benefit obligations by $1.0 billion.