Citibank 2009 Annual Report Download - page 165
Download and view the complete annual report
Please find page 165 of the 2009 Citibank annual report below. You can navigate through the pages in the report by either clicking on the pages listed below, or by using the keyword search tool below to find specific information within the annual report.-
 1
1 -
2
-
3
-
4
-
5
-
6
-
7
-
8
-
9
-
10
-
11
-
12
-
13
-
14
-
15
-
16
-
17
-
18
-
19
-
20
-
21
-
22
-
23
-
24
-
25
-
26
-
27
-
28
-
29
-
30
-
31
-
32
-
33
-
34
-
35
-
36
-
37
-
38
-
39
-
40
-
41
-
42
-
43
-
44
-
45
-
46
-
47
-
48
-
49
-
50
-
51
-
52
-
53
-
54
-
55
-
56
-
57
-
58
-
59
-
60
-
61
-
62
-
63
-
64
-
65
-
66
-
67
-
68
-
69
-
70
-
71
-
72
-
73
-
74
-
75
-
76
-
77
-
78
-
79
-
80
-
81
-
82
-
83
-
84
-
85
-
86
-
87
-
88
-
89
-
90
-
91
-
92
-
93
-
94
-
95
-
96
-
97
-
98
-
99
-
100
-
101
-
102
-
103
-
104
-
105
-
106
-
107
-
108
-
109
-
110
-
111
-
112
-
113
-
114
-
115
-
116
-
117
-
118
-
119
-
120
-
121
-
122
-
123
-
124
-
125
-
126
-
127
-
128
-
129
-
130
-
131
-
132
-
133
-
134
-
135
-
136
-
137
-
138
-
139
-
140
-
141
-
142
-
143
-
144
-
145
-
146
-
147
-
148
-
149
-
150
-
151
-
152
-
153
-
154
-
 155
155 -
 156
156 -
 157
157 -
 158
158 -
 159
159 -
 160
160 -
 161
161 -
 162
162 -
 163
163 -
 164
164 -
 165
165 -
 166
166 -
 167
167 -
 168
168 -
 169
169 -
 170
170 -
 171
171 -
 172
172 -
 173
173 -
 174
174 -
 175
175 -
176
-
177
-
178
-
179
-
180
-
181
-
182
-
183
-
184
-
185
-
186
-
187
-
188
-
189
-
190
-
191
-
192
-
193
-
194
-
195
-
196
-
197
-
198
-
199
-
200
-
201
-
202
-
203
-
204
-
205
-
206
-
207
-
208
-
209
-
210
-
211
-
212
-
213
-
214
-
215
-
216
-
217
-
218
-
219
-
220
-
221
-
222
-
223
-
224
-
225
-
226
-
227
-
228
-
229
-
230
-
231
-
232
-
233
-
234
-
235
-
236
-
237
-
238
-
239
-
240
-
241
-
242
-
243
-
244
-
245
-
246
-
247
-
248
-
249
-
250
-
251
-
252
-
253
-
254
-
255
-
256
-
257
-
258
-
259
-
260
-
261
-
262
-
263
-
264
-
265
-
266
-
267
-
268
-
269
-
270
-
271
-
272
-
273
-
274
-
275
-
276
-
277
-
278
-
279
-
280
-
281
-
282
-
283
-
284
 |
 |

155
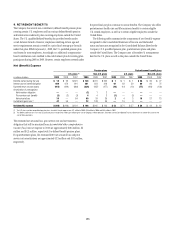
9. RETIREMENT BENEFITS
The Company has several non-contributory defined-benefit pension plans
covering certain U.S. employees and has various defined-benefit pension
and termination-indemnity plans covering employees outside the United
States. The U.S. qualified defined-benefit plan provides benefits under
a cash balance formula. However, employees satisfying certain age and
service requirements remain covered by a prior final-average pay formula
under that plan. Effective January 1, 2008, the U.S. qualified pension plan
was frozen for most employees. Accordingly, no additional compensation-
based contributions were credited to the cash-balance plan for existing plan
participants during 2008 or 2009. However, certain employees covered under
the prior final-pay plan continue to accrue benefits. The Company also offers
postretirement health care and life insurance benefits to certain eligible
U.S. retired employees, as well as to certain eligible employees outside the
United States.
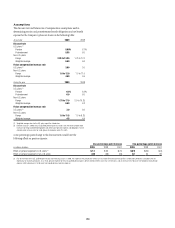
The following tables summarize the components of net (benefit) expense
recognized in the Consolidated Statement of Income and the funded
status and amounts recognized in the Consolidated Balance Sheet for the
Company’s U.S. qualified pension plan, postretirement plans and plans
outside the United States. The Company uses a December 31 measurement
date for the U.S. plans as well as the plans outside the United States.
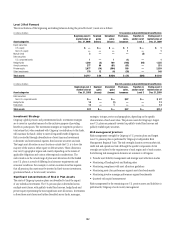
Net (Benefit) Expense
Pension plans Postretirement benefit plans
U.S. plans (1) Non-U.S. plans U.S. plans Non-U.S. plans
In millions of dollars 2009 2008 2007 2009 2008 2007 2009 2008 2007 2009 2008 2007
Benefits earned during the year $ 18 $ 23 $ 301 $ 148 $ 201 $ 202 $ 1 $ 1 $ 1 $ 26 $ 36 $ 27
Interest cost on benefit obligation 649 674 641 301 354 318 61 62 59 89 96 75
Expected return on plan assets (912) (949) (889) (336) (487) (477) (10) (12) (12) (77) (109) (103)
Amortization of unrecognized
Net transition obligation —— — (1) 1 2 —— — —— —
Prior service cost (benefit) (1) (2) (3) 44 3 (1) — (3) —— —
Net actuarial loss 10 — 84 60 24 39 24 3 18 21 13
Curtailment (gain) loss (2) 47 56 — 22 108 36 —16 9 —— —
Net (benefit) expense $(189) $(198) $ 134 $ 198 $ 205 $ 123 $ 53 $ 71 $ 57 $ 56 $ 44 $ 12
(1) The U.S. plans exclude nonqualified pension plans, for which the net expense was $41 million in 2009, $38 million in 2008 and $45 million in 2007.
(2) The 2009 curtailment loss in the non-U.S pension plans includes $18 million gain reflecting the sale of Citigroup’s Nikko operations. See Note 3 to the Consolidated Financial Statements for further discussion of the
sale of Nikko operations.
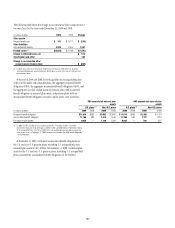
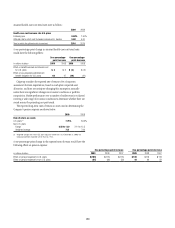
The estimated net actuarial loss, prior service cost and net transition
obligation that will be amortized from Accumulated other comprehensive
income (loss) into net expense in 2010 are approximately $104 million, $2
million and $(2) million, respectively, for defined-benefit pension plans.
For postretirement plans, the estimated 2010 net actuarial loss and prior
service cost amortizations are approximately $21 million and $(3) million,
respectively.