Citibank 2009 Annual Report Download - page 59
Download and view the complete annual report
Please find page 59 of the 2009 Citibank annual report below. You can navigate through the pages in the report by either clicking on the pages listed below, or by using the keyword search tool below to find specific information within the annual report.-
 1
1 -
2
-
3
-
4
-
5
-
6
-
7
-
8
-
9
-
10
-
11
-
12
-
13
-
14
-
15
-
16
-
17
-
18
-
19
-
20
-
21
-
22
-
23
-
24
-
25
-
26
-
27
-
28
-
29
-
30
-
31
-
32
-
33
-
34
-
35
-
36
-
37
-
38
-
39
-
40
-
41
-
42
-
43
-
44
-
45
-
46
-
47
-
48
-
 49
49 -
 50
50 -
 51
51 -
 52
52 -
 53
53 -
 54
54 -
 55
55 -
 56
56 -
 57
57 -
 58
58 -
 59
59 -
 60
60 -
 61
61 -
 62
62 -
 63
63 -
 64
64 -
 65
65 -
 66
66 -
 67
67 -
 68
68 -
 69
69 -
70
-
71
-
72
-
73
-
74
-
75
-
76
-
77
-
78
-
79
-
80
-
81
-
82
-
83
-
84
-
85
-
86
-
87
-
88
-
89
-
90
-
91
-
92
-
93
-
94
-
95
-
96
-
97
-
98
-
99
-
100
-
101
-
102
-
103
-
104
-
105
-
106
-
107
-
108
-
109
-
110
-
111
-
112
-
113
-
114
-
115
-
116
-
117
-
118
-
119
-
120
-
121
-
122
-
123
-
124
-
125
-
126
-
127
-
128
-
129
-
130
-
131
-
132
-
133
-
134
-
135
-
136
-
137
-
138
-
139
-
140
-
141
-
142
-
143
-
144
-
145
-
146
-
147
-
148
-
149
-
150
-
151
-
152
-
153
-
154
-
155
-
156
-
157
-
158
-
159
-
160
-
161
-
162
-
163
-
164
-
165
-
166
-
167
-
168
-
169
-
170
-
171
-
172
-
173
-
174
-
175
-
176
-
177
-
178
-
179
-
180
-
181
-
182
-
183
-
184
-
185
-
186
-
187
-
188
-
189
-
190
-
191
-
192
-
193
-
194
-
195
-
196
-
197
-
198
-
199
-
200
-
201
-
202
-
203
-
204
-
205
-
206
-
207
-
208
-
209
-
210
-
211
-
212
-
213
-
214
-
215
-
216
-
217
-
218
-
219
-
220
-
221
-
222
-
223
-
224
-
225
-
226
-
227
-
228
-
229
-
230
-
231
-
232
-
233
-
234
-
235
-
236
-
237
-
238
-
239
-
240
-
241
-
242
-
243
-
244
-
245
-
246
-
247
-
248
-
249
-
250
-
251
-
252
-
253
-
254
-
255
-
256
-
257
-
258
-
259
-
260
-
261
-
262
-
263
-
264
-
265
-
266
-
267
-
268
-
269
-
270
-
271
-
272
-
273
-
274
-
275
-
276
-
277
-
278
-
279
-
280
-
281
-
282
-
283
-
284
 |
 |

49
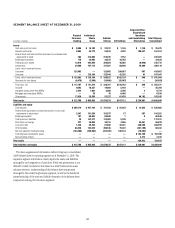
In addition to growing its deposit base and engaging in long-term debt
funding, Citi has been actively building its structural liquidity by reducing
total assets. Total assets as of December 31, 2009 have declined 4% as
compared to December 31, 2008. Loans (net of allowance), which are one
of Citi’s most illiquid assets, are down $109 billion, or approximately 15%.
Deposits as a percentage of loans have increased to 150% as of December 31,
2009 from 116% as of December 31, 2008. Structural liquidity, defined as the
sum of deposits, long-term debt and stockholders’ equity as a percentage of
total assets, has increased steadily through 2008 and 2009 and was 73% at
December 31, 2009, as compared with 66% at December 31, 2008.
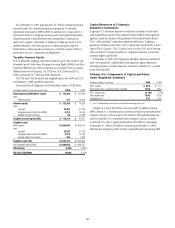
Aggregate Liquidity Resources
Parent and broker-dealer Significant bank entities Total
In billions of dollars at year end 2009 2008 2009 2008 2009 2008
Cash at major central banks $10.4 $49.2 $105.1 $ 74.5 $ 115.5 $ 123.7
Liquid securities and assets pledged at major central banks 76.4 22.8 123.6 53.8 200.0 76.6
Total $86.8 $72.0 $228.7 $128.3 $ 315.5 $ 200.3
As noted in the table above, Citigroup’s aggregate liquidity resources
totaled $315.5 billion as of December 31, 2009, compared with $200.3
billion as of December 31, 2008. As of December 31, 2009, Citigroup’s and
its affiliates’ liquidity portfolio and broker-dealer “cash box” totaled $86.8
billion as compared with $72.0 billion at December 31, 2008. This includes
the liquidity portfolio and cash box held in the U.S. as well as government
bonds held by Citigroup’s broker-dealer entities in the United Kingdom and
Japan. Further, at December 31, 2009, Citigroup’s bank subsidiaries had an
aggregate of approximately $105.1 billion of cash on deposit with major
Central Banks (including the U.S. Federal Reserve Bank of New York, the
European Central Bank, Bank of England, Swiss National Bank, Bank of
Japan, the Monetary Authority of Singapore, and the Hong Kong Monetary
Authority), compared with approximately $74.5 billion at December 31,
2008. Citigroup’s bank subsidiaries also have significant additional liquidity
resources through unencumbered highly liquid securities available for
secured funding through private markets or that are, or could be, pledged to
the major Central Banks and the U.S. Federal Home Loan Banks. The value
of these liquid securities was $123.6 billion at December 31, 2009 compared
with $53.8 billion at December 31, 2008. Significant amounts of cash and
liquid securities are also available in other Citigroup entities.
Consistent with the strategic reconfiguration of Citi’s balance sheet, the
build-up of liquidity resources and the shift in focus on increasing structural
liabilities, Citigroup entered 2010 with much of its required long-term debt
funding already in place. As a consequence, it is currently expected that the
direct long-term funding requirements for Citigroup and CFI in 2010 will be
$15 billion, which is well below the $39 billion of expected maturities.
Banking Subsidiaries—Constraints
on Supplying Funds
There are various legal and regulatory limitations on the ability of
Citigroup’s subsidiary depository institutions to pay dividends, extend credit
or otherwise supply funds to Citigroup and its non-bank subsidiaries. In
determining the declaration of dividends, each depository institution must
also consider its effect on applicable risk-based capital and leverage ratio
requirements, as well as policy statements of the federal regulatory agencies
that indicate that banking organizations should generally pay dividends out
of current operating earnings. Citigroup did not receive any dividends from
its banking subsidiaries during 2009.
Some of Citigroup’s non-bank subsidiaries have credit facilities with
Citigroup’s subsidiary depository institutions, including Citibank, N.A.
Borrowings under these facilities must be secured in accordance with
Section 23A of the Federal Reserve Act. There are various legal restrictions on
the extent to which Citi’s subsidiary depository institutions can lend or extend
credit to or engage in certain other transactions with Citigroup and certain of
its non-bank subsidiaries. In general, transactions must be on arm’s-length
terms and be secured by designated amounts of specified collateral. See Note
20 to the Consolidated Financial Statements.
Management of Liquidity
Management of liquidity at Citigroup is the responsibility of the Treasurer.
Citigroup runs a centralized treasury model where the overall balance sheet
is managed by Citigroup Treasury through Global Franchise Treasurers
and Regional Treasurers. Day-to-day liquidity and funding are managed by
treasurers at the country and business level and are monitored by Corporate
Treasury and independent risk management.
A uniform liquidity risk management policy exists for Citigroup, its
consolidated subsidiaries and managed affiliates. Under this policy, there
is a single set of standards for the measurement of liquidity risk in order to
ensure consistency across businesses, stability in methodologies, transparency
of risk, and establishment of appropriate risk appetite.