Citibank 2009 Annual Report Download - page 60
Download and view the complete annual report
Please find page 60 of the 2009 Citibank annual report below. You can navigate through the pages in the report by either clicking on the pages listed below, or by using the keyword search tool below to find specific information within the annual report.-
 1
1 -
2
-
3
-
4
-
5
-
6
-
7
-
8
-
9
-
10
-
11
-
12
-
13
-
14
-
15
-
16
-
17
-
18
-
19
-
20
-
21
-
22
-
23
-
24
-
25
-
26
-
27
-
28
-
29
-
30
-
31
-
32
-
33
-
34
-
35
-
36
-
37
-
38
-
39
-
40
-
41
-
42
-
43
-
44
-
45
-
46
-
47
-
48
-
49
-
 50
50 -
 51
51 -
 52
52 -
 53
53 -
 54
54 -
 55
55 -
 56
56 -
 57
57 -
 58
58 -
 59
59 -
 60
60 -
 61
61 -
 62
62 -
 63
63 -
 64
64 -
 65
65 -
 66
66 -
 67
67 -
 68
68 -
 69
69 -
 70
70 -
71
-
72
-
73
-
74
-
75
-
76
-
77
-
78
-
79
-
80
-
81
-
82
-
83
-
84
-
85
-
86
-
87
-
88
-
89
-
90
-
91
-
92
-
93
-
94
-
95
-
96
-
97
-
98
-
99
-
100
-
101
-
102
-
103
-
104
-
105
-
106
-
107
-
108
-
109
-
110
-
111
-
112
-
113
-
114
-
115
-
116
-
117
-
118
-
119
-
120
-
121
-
122
-
123
-
124
-
125
-
126
-
127
-
128
-
129
-
130
-
131
-
132
-
133
-
134
-
135
-
136
-
137
-
138
-
139
-
140
-
141
-
142
-
143
-
144
-
145
-
146
-
147
-
148
-
149
-
150
-
151
-
152
-
153
-
154
-
155
-
156
-
157
-
158
-
159
-
160
-
161
-
162
-
163
-
164
-
165
-
166
-
167
-
168
-
169
-
170
-
171
-
172
-
173
-
174
-
175
-
176
-
177
-
178
-
179
-
180
-
181
-
182
-
183
-
184
-
185
-
186
-
187
-
188
-
189
-
190
-
191
-
192
-
193
-
194
-
195
-
196
-
197
-
198
-
199
-
200
-
201
-
202
-
203
-
204
-
205
-
206
-
207
-
208
-
209
-
210
-
211
-
212
-
213
-
214
-
215
-
216
-
217
-
218
-
219
-
220
-
221
-
222
-
223
-
224
-
225
-
226
-
227
-
228
-
229
-
230
-
231
-
232
-
233
-
234
-
235
-
236
-
237
-
238
-
239
-
240
-
241
-
242
-
243
-
244
-
245
-
246
-
247
-
248
-
249
-
250
-
251
-
252
-
253
-
254
-
255
-
256
-
257
-
258
-
259
-
260
-
261
-
262
-
263
-
264
-
265
-
266
-
267
-
268
-
269
-
270
-
271
-
272
-
273
-
274
-
275
-
276
-
277
-
278
-
279
-
280
-
281
-
282
-
283
-
284
 |
 |
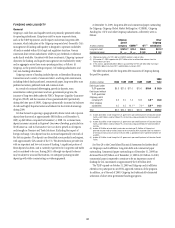
50
Liquidity management is overseen by the Board of Directors through
its Risk Management and Finance Committee and by senior management
through Citigroup’s Finance and Asset and Liability Committee (FinALCO).
One of the objectives of the Risk Management and Finance Committee of
Citigroup’s Board of Directors as well as the FinALCO is to monitor and review
overall liquidity policies and practices as well as the liquidity and balance
sheet positions of Citigroup and its principal subsidiaries. Additionally,
oversight of liquidity is provided by Citigroup’s Global Asset and Liability
Committee. Asset and Liability Committees are also established for each
region, country and/or major line of business.
MONITORING LIQUIDITY
Funding and Liquidity Plans
Each principal operating subsidiary and/or country must prepare a Funding
and Liquidity Plan for approval by the Treasurer and independent risk
management. For significant entities, as defined by balance sheet size and
the liquidity risk position, the Funding and Liquidity Plan is prepared and
approved on an annual basis. The Funding and Liquidity Plan addresses
strategic liquidity issues and establishes the parameters for identifying,
measuring, monitoring and limiting liquidity risk and sets forth key
assumptions for liquidity risk management. The Funding and Liquidity Plan
includes analysis of the balance sheet, as well as the economic and business
conditions impacting, or potentially impacting, the liquidity of the major
operating subsidiary and/or country. As part of the Funding and Liquidity
Plan, liquidity limits, liquidity ratios, market triggers, and assumptions for
periodic stress tests are established and approved.
Risk Tolerance
Citigroup establishes its key risk tolerances based on stress tests and a cash
capital ratio (as described in “Liquidity Ratios” below). This framework
requires that entities be self-sufficient or net providers of liquidity in their
designated stress tests and have excess cash capital. Aggregate self sufficiency
targets have been established for the banking subsidiaries, Citigroup, the
parent holding company, and CGMHI as well as for individual entities as part
of their Funding and Liquidity Plans. In addition, an important benchmark
for the combined Citigroup, the parent holding company, and CGMHI is to
maintain sufficient liquidity to meet all maturing obligations for a one-year
period without access to the unsecured wholesale markets.
Within this context, there are a series of tools used to monitor Citigroup’s
liquidity position. These include liquidity gaps and associated limits, liquidity
ratios, stress testing and market triggers, as described below.
Liquidity Gaps and Limits
Citigroup uses a monitoring tool that measures potential funding gaps over
various time horizons in a standard operating environment. The gap for
any given funding need represents the potential market access required,
or placements to the market (internal or external) over designated tenors.
Limits establish risk appetite for potential market access in standard
operating conditions and are monitored against the liquidity position
on a daily basis. Limits are established based on evaluation of available
contingent actions and liquidity vulnerabilities under designated stress
scenarios. While the contingent capacity places a cap on the limits, the limits
are also evaluated based on the structural liquidity of the balance sheet,
stability of liabilities, liquidity of assets, depth of markets, the experience
of management, size of the balance sheet, historical utilization, and an
evaluation of expected business and funding strategy. Limits are established
such that in stress scenarios, entities are self-funded or net providers of
liquidity. Thus, the risk tolerance for liquidity funding gaps is limited based
on the capacity to cover the position in a stressed environment. These limits
are the key daily risk-management tool for Citigroup, the parent holding
company, and its banking subsidiaries.
Liquidity Ratios
A series of standard corporate-wide liquidity ratios has been established
to monitor the structural elements of Citigroup’s liquidity. One of the
key structural liquidity measures is the cash capital ratio. Cash capital is
a broader measure of the ability to fund the structurally illiquid portion
of Citigroup’s balance sheet than traditional measures such as deposits
to loans or core deposits to loans. Cash capital measures the amount of
long-term funding (>1 year) available to fund illiquid assets. Long-term
funding includes core customer deposits, long-term debt and equity. Illiquid
assets include loans (net of liquidity adjustments), illiquid securities,
securities haircuts and other assets (i.e., goodwill, intangibles, fixed assets,
receivables, etc.). Cash capital targets are established for Citigroup, the
parent holding company, CGMHI and Citigroup’s aggregate banking
subsidiaries. In addition, each entity is required to calculate a cash capital
ratio on a monthly basis. Benchmarks must be established and approved for
the cash capital ratio as part of the entities’ Funding and Liquidity plan. At
December 31, 2009, the combined Citigroup, the parent holding company,
and CGMHI, as well as the aggregate banking subsidiaries had an excess of
cash capital. In addition, as of December 31, 2009 the combined Citigroup,
the parent holding company, and CGMHI maintained liquidity to meet all
maturing obligations significantly in excess of a one-year period without
access to the unsecured wholesale markets.