Citibank 2009 Annual Report Download - page 267
Download and view the complete annual report
Please find page 267 of the 2009 Citibank annual report below. You can navigate through the pages in the report by either clicking on the pages listed below, or by using the keyword search tool below to find specific information within the annual report.-
 1
1 -
2
-
3
-
4
-
5
-
6
-
7
-
8
-
9
-
10
-
11
-
12
-
13
-
14
-
15
-
16
-
17
-
18
-
19
-
20
-
21
-
22
-
23
-
24
-
25
-
26
-
27
-
28
-
29
-
30
-
31
-
32
-
33
-
34
-
35
-
36
-
37
-
38
-
39
-
40
-
41
-
42
-
43
-
44
-
45
-
46
-
47
-
48
-
49
-
50
-
51
-
52
-
53
-
54
-
55
-
56
-
57
-
58
-
59
-
60
-
61
-
62
-
63
-
64
-
65
-
66
-
67
-
68
-
69
-
70
-
71
-
72
-
73
-
74
-
75
-
76
-
77
-
78
-
79
-
80
-
81
-
82
-
83
-
84
-
85
-
86
-
87
-
88
-
89
-
90
-
91
-
92
-
93
-
94
-
95
-
96
-
97
-
98
-
99
-
100
-
101
-
102
-
103
-
104
-
105
-
106
-
107
-
108
-
109
-
110
-
111
-
112
-
113
-
114
-
115
-
116
-
117
-
118
-
119
-
120
-
121
-
122
-
123
-
124
-
125
-
126
-
127
-
128
-
129
-
130
-
131
-
132
-
133
-
134
-
135
-
136
-
137
-
138
-
139
-
140
-
141
-
142
-
143
-
144
-
145
-
146
-
147
-
148
-
149
-
150
-
151
-
152
-
153
-
154
-
155
-
156
-
157
-
158
-
159
-
160
-
161
-
162
-
163
-
164
-
165
-
166
-
167
-
168
-
169
-
170
-
171
-
172
-
173
-
174
-
175
-
176
-
177
-
178
-
179
-
180
-
181
-
182
-
183
-
184
-
185
-
186
-
187
-
188
-
189
-
190
-
191
-
192
-
193
-
194
-
195
-
196
-
197
-
198
-
199
-
200
-
201
-
202
-
203
-
204
-
205
-
206
-
207
-
208
-
209
-
210
-
211
-
212
-
213
-
214
-
215
-
216
-
217
-
218
-
219
-
220
-
221
-
222
-
223
-
224
-
225
-
226
-
227
-
228
-
229
-
230
-
231
-
232
-
233
-
234
-
235
-
236
-
237
-
238
-
239
-
240
-
241
-
242
-
243
-
244
-
245
-
246
-
247
-
248
-
249
-
250
-
251
-
252
-
253
-
254
-
255
-
256
-
 257
257 -
 258
258 -
 259
259 -
 260
260 -
 261
261 -
 262
262 -
 263
263 -
 264
264 -
 265
265 -
 266
266 -
 267
267 -
 268
268 -
 269
269 -
 270
270 -
 271
271 -
 272
272 -
 273
273 -
 274
274 -
 275
275 -
 276
276 -
 277
277 -
278
-
279
-
280
-
281
-
282
-
283
-
284
 |
 |

257
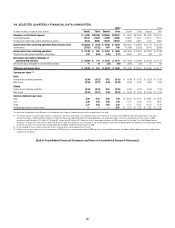
34. SELECTED QUARTERLY FINANCIAL DATA (UNAUDITED)
2009 (1) 2008 (1)
In millions of dollars, except per share amounts Fourth Third Second First Fourth Third Second First
Revenues, net of interest expense $ 5,405 $20,390 $29,969 $24,521 $ 5,646 $16,258 $17,538 $ 12,157
Operating expenses 12,314 11,824 11,999 11,685 24,642 14,007 15,214 15,377
Provisions for credit losses and for benefits and claims 8,184 9,095 12,676 10,307 12,695 9,067 7,100 5,852
Income (loss) from continuing operations before income taxes $(15,093) $ (529) $ 5,294 $ 2,529 $(31,691) $ (6,816) $ (4,776) $ (9,072)
Income taxes (7,353) (1,122) 907 835 (10,698) (3,295) (2,447) (3,886)
Income (loss) from continuing operations $ (7,740) $ 593 $ 4,387 $ 1,694 $(20,993) $ (3,521) $ (2,329) $ (5,186)
Income from discontinued operations, net of taxes 232 (418) (142) (117) 3,424 613 (94) 59
Net income (loss) before attribution of
noncontrolling interests $ (7,508) $ 175 $ 4,245 $ 1,577 $(17,569) $ (2,908) $ (2,423) $ (5,127)
Net income (loss) attributable to noncontrolling interests 71 74 (34) (16) (306) (93) 72 (16)
Citigroup’s net income (loss) $ (7,579) $ 101 $ 4,279 $ 1,593 $(17,263) $ (2,815) $ (2,495) $ (5,111)
Earnings per share (2) (3)
Basic
Income from continuing operations (0.34) (0.23) 0.51 (0.16) $ (4.04) $ (0.73) $ (0.53) $ (1.05)
Net income (0.33) (0.27) 0.49 (0.18) (3.40) (0.61) (0.55) (1.03)
Diluted
Income from continuing operations (0.34) (0.23) 0.51 (0.16) (4.04) (0.73) (0.53) (1.05)
Net income (0.33) (0.27) 0.49 (0.18) $ (3.40) $ (0.61) $ (0.55) $ (1.03)
Common stock price per share
High 5.00 5.23 4.02 7.46 $ 23.00 $ 21.12 $ 26.81 $ 29.69
Low 3.20 2.59 2.68 1.02 3.77 14.03 16.76 18.62
Close 3.31 4.84 2.97 2.53 6.71 20.51 16.76 21.42
Dividends per share of common stock — — — 0.01 $ 0.16 $ 0.32 $ 0.32 $ 0.32
This Note to the Consolidated Financial Statements is unaudited due to the Company’s individual quarterly results not being subject to an audit.
(1) The revenue and (after-tax impact) of the Company’s correction of a CVA error in prior periods, which reduced revenues and net income in the fourth quarter of 2009 by $840 million ($518 million), respectively,
related to the quarters in 2008 and 2009 as follows: $7 million ($4 million), $58 million ($36 million), $97 million ($60 million), $44 million ($27 million), for the first, second, third and fourth quarters of 2008,
respectively, and $198 million ($122 million), $115 million ($71 million) and $197 million ($121 million) for the first, second and third quarters of 2009, respectively. See also Note 1 to the Consolidated Financial
Statements. The impact of this CVA error was determined not to be material to the Company’s results of operations and financial position for any previously reported period. Consequently, in the accompanying selected
quarterly financial data, the cumulative effect through September 30, 2009 is recorded in the fourth quarter of 2009.
(2) Due to averaging of shares, quarterly earnings per share may not add up to the totals reported for the full year.
(3) Diluted shares are equal to basic shares for all four quarters of 2008 and the first, third and fourth quarter of 2009 due to the net loss available to common shareholders. Adding additional shares to the denominator
would result in anti-dilution.
[End of Consolidated Financial Statements and Notes to Consolidated Financial Statements]