Citibank 2009 Annual Report Download - page 83
Download and view the complete annual report
Please find page 83 of the 2009 Citibank annual report below. You can navigate through the pages in the report by either clicking on the pages listed below, or by using the keyword search tool below to find specific information within the annual report.-
 1
1 -
2
-
3
-
4
-
5
-
6
-
7
-
8
-
9
-
10
-
11
-
12
-
13
-
14
-
15
-
16
-
17
-
18
-
19
-
20
-
21
-
22
-
23
-
24
-
25
-
26
-
27
-
28
-
29
-
30
-
31
-
32
-
33
-
34
-
35
-
36
-
37
-
38
-
39
-
40
-
41
-
42
-
43
-
44
-
45
-
46
-
47
-
48
-
49
-
50
-
51
-
52
-
53
-
54
-
55
-
56
-
57
-
58
-
59
-
60
-
61
-
62
-
63
-
64
-
65
-
66
-
67
-
68
-
69
-
70
-
71
-
72
-
 73
73 -
 74
74 -
 75
75 -
 76
76 -
 77
77 -
 78
78 -
 79
79 -
 80
80 -
 81
81 -
 82
82 -
 83
83 -
 84
84 -
 85
85 -
 86
86 -
 87
87 -
 88
88 -
 89
89 -
 90
90 -
 91
91 -
 92
92 -
 93
93 -
94
-
95
-
96
-
97
-
98
-
99
-
100
-
101
-
102
-
103
-
104
-
105
-
106
-
107
-
108
-
109
-
110
-
111
-
112
-
113
-
114
-
115
-
116
-
117
-
118
-
119
-
120
-
121
-
122
-
123
-
124
-
125
-
126
-
127
-
128
-
129
-
130
-
131
-
132
-
133
-
134
-
135
-
136
-
137
-
138
-
139
-
140
-
141
-
142
-
143
-
144
-
145
-
146
-
147
-
148
-
149
-
150
-
151
-
152
-
153
-
154
-
155
-
156
-
157
-
158
-
159
-
160
-
161
-
162
-
163
-
164
-
165
-
166
-
167
-
168
-
169
-
170
-
171
-
172
-
173
-
174
-
175
-
176
-
177
-
178
-
179
-
180
-
181
-
182
-
183
-
184
-
185
-
186
-
187
-
188
-
189
-
190
-
191
-
192
-
193
-
194
-
195
-
196
-
197
-
198
-
199
-
200
-
201
-
202
-
203
-
204
-
205
-
206
-
207
-
208
-
209
-
210
-
211
-
212
-
213
-
214
-
215
-
216
-
217
-
218
-
219
-
220
-
221
-
222
-
223
-
224
-
225
-
226
-
227
-
228
-
229
-
230
-
231
-
232
-
233
-
234
-
235
-
236
-
237
-
238
-
239
-
240
-
241
-
242
-
243
-
244
-
245
-
246
-
247
-
248
-
249
-
250
-
251
-
252
-
253
-
254
-
255
-
256
-
257
-
258
-
259
-
260
-
261
-
262
-
263
-
264
-
265
-
266
-
267
-
268
-
269
-
270
-
271
-
272
-
273
-
274
-
275
-
276
-
277
-
278
-
279
-
280
-
281
-
282
-
283
-
284
 |
 |
73
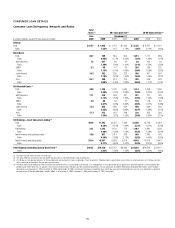
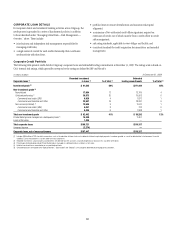
U.S. CONSUMER LENDING
Mortgage Lending
Overview
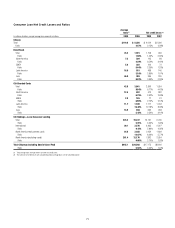
Citi’s North America consumer mortgage portfolio consists of both first lien
and second lien mortgages. As of December 31, 2009, the first lien mortgage
portfolio in LCL totaled approximately $118 billion while the second lien
mortgage portfolio in LCL was approximately $54 billion. Although the
majority of the mortgage portfolio is managed by LCL within Citi Holdings,
there are $0.5 billion of first lien mortgages and $1.7 billion of second lien
mortgages reported in Citicorp. Additionally, as mentioned above, in the
first quarter of 2010, approximately $34 billion of U.S. mortgages will be
transferred from LCL within Citi Holdings to NA RCB within Citicorp.
Citi’s first lien mortgage portfolio includes $9.0 billion of loans with
Federal Housing Administration or Veterans Administration guarantees.
These portfolios consist of loans originated to low-to-moderate-income
borrowers with lower FICO (Fair Isaac Corporation) scores and generally
have higher loan-to-value ratios (LTVs). These loans have high delinquency
rates but, given the guarantees, Citi has experienced negligible credit losses
on these loans. The first lien mortgage portfolio also includes $1.8 billion of
loans with LTVs above 80%, which have insurance through private mortgage
insurance (PMI) companies, and $3.5 billion of loans subject to Long-Term
Standby Commitments1 with U.S. government sponsored enterprises (GSE),
for which Citi has limited exposure to credit losses.
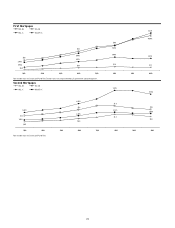
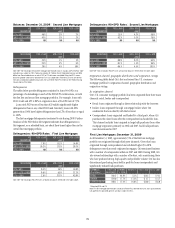
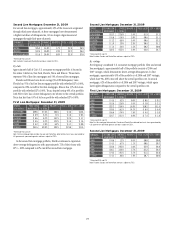
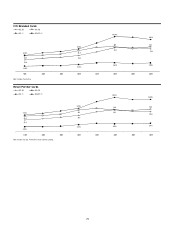
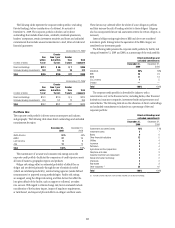
The following charts detail the quarterly trends in delinquencies and
net credit losses for Citi’s first and second North America consumer
mortgage portfolios.
For first mortgages, both delinquencies and net credit losses are impacted
by the HAMP trial loans in the U.S. mortgage portfolio. As set forth in the
first chart, first mortgage delinquencies rates continued to increase in
2009, exacerbated in part by the reduction in loan balances. The continued
increase in first mortgage delinquencies during the third and fourth
quarters of 2009 was primarily attributable to both the growing backlog of
foreclosures in process and HAMP modifications.
The growing amount of foreclosures in process, which is related to an
industry-wide phenomenon resulting from foreclosure moratoria and other
efforts to prevent or forestall foreclosure, have specific implications on
the portfolio:
• It tends to inflate the amount of 180+ day delinquencies in our mortgage
statistics.
It can result in increasing levels of consumer non-accrual loans, as we are •
unable to take possession of the underlying assets and sell these properties
on a timely basis.
It may have a dampening effect on NIM as non-accrual assets build on •
the Company’s balance sheet.
As discussed in “Consumer Loan Modification Programs” above,
Citigroup offers short-term and long-term real estate loan modification
programs. Citi monitors the performance of its real estate loan modification
programs by tracking credit loss rates by vintage. At 18 months after
modifying an account, in Citi’s experience to date, we typically reduce credit
loss rates by approximately one-third compared to similar accounts that were
not modified.
Currently, Citi’s efforts are concentrated on the HAMP. Contractual
modifications of loans that successfully completed the HAMP trial period
began in September 2009; accordingly, this is the earliest HAMP vintage
available for comparison. While early indications of the performance of
these HAMP modifications are encouraging, Citi remains cautious and
will continue to monitor the performance of these HAMP and non-HAMP
modification programs and their impact on reducing Citi’s credit losses.
As previously disclosed, loans in the HAMP trial modification period that
do not make their original contractual payment are reported as delinquent,
even if the reduced payments agreed to under the program are made by the
borrower. Further, HAMP trial modifications have the effect of marginally
reducing our net credit losses and increasing our required loan loss reserves.
Specifically, the HAMP impacted Citi’s net credit losses in the first mortgage
portfolio during the third and fourth quarters of 2009 as loans in the trial
period are not charged off at 180 DPD as long as they have made at least one
payment. Citigroup has increased its loan loss provisions to appropriately
reserve for this risk.
Citigroup believes that the success rate of the HAMP will be a key factor
influencing net credit losses from delinquent first mortgage loans, at least
during the first half of 2010, and the outcome of the program will largely
depend on the success rates of borrowers completing the trial period and
meeting the documentation requirements.
By contrast, second mortgages continue to show positive trends in
both net credit losses and delinquencies, reflecting the impact of portfolio
re-positioning and loss mitigation. Citi continues to actively manage
this exposure by reducing the riskiest accounts, including by tightening
credit requirements through higher FICOs, lower LTVs, and increased
documentation and verifications. As discussed under “Risk Factors,”
Citigroup is actively engaged in discussions with the U.S. Treasury for the
second lien program under HAMP.
1 A Long-Term Standby Commitment (LTSC) is a structured transaction in which Citi transfers
the credit risk of certain eligible loans to an investor in exchange for a fee. These loans remain
on balance sheet unless they reach a certain delinquency level (between 120 and 180 days), in
which case the LTSC investor is required to buy the loan at par.