Citibank 2009 Annual Report Download - page 246
Download and view the complete annual report
Please find page 246 of the 2009 Citibank annual report below. You can navigate through the pages in the report by either clicking on the pages listed below, or by using the keyword search tool below to find specific information within the annual report.-
 1
1 -
2
-
3
-
4
-
5
-
6
-
7
-
8
-
9
-
10
-
11
-
12
-
13
-
14
-
15
-
16
-
17
-
18
-
19
-
20
-
21
-
22
-
23
-
24
-
25
-
26
-
27
-
28
-
29
-
30
-
31
-
32
-
33
-
34
-
35
-
36
-
37
-
38
-
39
-
40
-
41
-
42
-
43
-
44
-
45
-
46
-
47
-
48
-
49
-
50
-
51
-
52
-
53
-
54
-
55
-
56
-
57
-
58
-
59
-
60
-
61
-
62
-
63
-
64
-
65
-
66
-
67
-
68
-
69
-
70
-
71
-
72
-
73
-
74
-
75
-
76
-
77
-
78
-
79
-
80
-
81
-
82
-
83
-
84
-
85
-
86
-
87
-
88
-
89
-
90
-
91
-
92
-
93
-
94
-
95
-
96
-
97
-
98
-
99
-
100
-
101
-
102
-
103
-
104
-
105
-
106
-
107
-
108
-
109
-
110
-
111
-
112
-
113
-
114
-
115
-
116
-
117
-
118
-
119
-
120
-
121
-
122
-
123
-
124
-
125
-
126
-
127
-
128
-
129
-
130
-
131
-
132
-
133
-
134
-
135
-
136
-
137
-
138
-
139
-
140
-
141
-
142
-
143
-
144
-
145
-
146
-
147
-
148
-
149
-
150
-
151
-
152
-
153
-
154
-
155
-
156
-
157
-
158
-
159
-
160
-
161
-
162
-
163
-
164
-
165
-
166
-
167
-
168
-
169
-
170
-
171
-
172
-
173
-
174
-
175
-
176
-
177
-
178
-
179
-
180
-
181
-
182
-
183
-
184
-
185
-
186
-
187
-
188
-
189
-
190
-
191
-
192
-
193
-
194
-
195
-
196
-
197
-
198
-
199
-
200
-
201
-
202
-
203
-
204
-
205
-
206
-
207
-
208
-
209
-
210
-
211
-
212
-
213
-
214
-
215
-
216
-
217
-
218
-
219
-
220
-
221
-
222
-
223
-
224
-
225
-
226
-
227
-
228
-
229
-
230
-
231
-
232
-
233
-
234
-
235
-
 236
236 -
 237
237 -
 238
238 -
 239
239 -
 240
240 -
 241
241 -
 242
242 -
 243
243 -
 244
244 -
 245
245 -
 246
246 -
 247
247 -
 248
248 -
 249
249 -
 250
250 -
 251
251 -
 252
252 -
 253
253 -
 254
254 -
 255
255 -
 256
256 -
257
-
258
-
259
-
260
-
261
-
262
-
263
-
264
-
265
-
266
-
267
-
268
-
269
-
270
-
271
-
272
-
273
-
274
-
275
-
276
-
277
-
278
-
279
-
280
-
281
-
282
-
283
-
284
 |
 |
236
Own Credit Valuation Adjustment
The fair value of debt liabilities for which the fair value option was elected
(other than non-recourse and similar liabilities) was impacted by the
narrowing of the Company’s credit spreads. The estimated change in the
fair value of these debt liabilities due to such changes in the Company’s own
credit risk (or instrument-specific credit risk) was a loss of $4.226 billion and
a gain of $4.558 billion for the years ended December 31, 2009 and 2008,
respectively. Changes in fair value resulting from changes in instrument-
specific credit risk were estimated by incorporating the Company’s current
observable credit spreads into the relevant valuation technique used to value
each liability as described above.
During the fourth quarter of 2008, the Company changed the source of its
credit spreads from those observed in the credit default swap market to those
observed in the bond market. Had this modification been in place since the
beginning of 2008, the change in the Company’s own credit spread would have
resulted in a gain of $2.49 billion and a gain of $2.02 billion for the three and
twelve months ended December 31, 2008, respectively. See also Note 1 to the
Consolidated Financial Statements for a discussion of the Company’s correction of
an error in the calculation of CVA for prior periods.
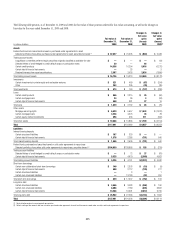
The Fair Value Option for Financial Assets and Financial
Liabilities
Selected portfolios of securities purchased under
agreements to resell, securities borrowed, securities sold
under agreements to repurchase, securities loaned and
certain non-collateralized short-term borrowings
The Company elected the fair value option retrospectively for our United
States and United Kingdom portfolios of fixed-income securities purchased
under agreements to resell and fixed-income securities sold under
agreements to repurchase (and certain non-collateralized short-term
borrowings). The fair value option was also elected prospectively in the
second quarter of 2007 for certain portfolios of fixed-income securities
lending and borrowing transactions based in Japan. In each case, the
election was made because the related interest-rate risk is managed on a
portfolio basis, primarily with derivative instruments that are accounted for
at fair value through earnings. Previously, these positions were accounted for
on an accrual basis.
Changes in fair value for transactions in these portfolios are recorded in
Principal transactions. The related interest revenue and interest expense are
measured based on the contractual rates specified in the transactions and are
reported as interest revenue and expense in the Consolidated Statement of Income.
Legg Mason convertible preferred equity securities
The Legg Mason convertible preferred equity securities (Legg shares) were
acquired in connection with the sale of Citigroup’s Asset Management
business in December 2005. Prior to the election of fair value option
accounting, the shares were classified as available-for-sale securities with
the unrealized loss of $232 million as of December 31, 2006 included in
Accumulated other comprehensive income (loss). This unrealized loss
was recorded upon election of a fair value as a reduction of January 1, 2007
Retained earnings as part of the cumulative-effect adjustment.
During the first quarter of 2008, the Company sold the remaining 8.4 million
Legg shares at a pretax loss of $10.3 million ($6.7 million after-tax).
Selected letters of credit and revolving loans hedged by
credit default swaps or participation notes
The Company has elected the fair value option for certain letters of credit
that are hedged with derivative instruments or participation notes. Upon
electing the fair value option, the related portions of the allowance for loan
losses and the allowance for unfunded lending commitments were reversed.
Citigroup elected the fair value option for these transactions because the risk
is managed on a fair value basis and mitigates accounting mismatches.
The notional amount of these unfunded letters of credit was $1.8 billion
as of December 31, 2009 and $1.4 billion as of December 31, 2008. The
amount funded was insignificant with no amounts 90 days or more past due
or on a non-accrual status at December 31, 2009 and 2008.
These items have been classified in Trading account assets or Trading
account liabilities on the Consolidated Balance Sheet. Changes in fair value
of these items are classified in Principal transactions in the Company’s
Consolidated Statement of Income.
Certain credit products
Citigroup has elected the fair value option for certain originated and
purchased loans, including certain unfunded loan products, such as
guarantees and letters of credit, executed by Citigroup’s trading businesses.
None of these credit products is a highly leveraged financing commitment.
Significant groups of transactions include loans and unfunded loan
products that are expected to be either sold or securitized in the near
term, or transactions where the economic risks are hedged with derivative
instruments such as purchased credit default swaps or total return swaps
where the Company pays the total return on the underlying loans to a third
party. Citigroup has elected the fair value option to mitigate accounting
mismatches in cases where hedge accounting is complex and to achieve
operational simplifications. Fair value was not elected for most lending
transactions across the Company, including where those management
objectives would not be met.