Citibank 2009 Annual Report Download - page 27
Download and view the complete annual report
Please find page 27 of the 2009 Citibank annual report below. You can navigate through the pages in the report by either clicking on the pages listed below, or by using the keyword search tool below to find specific information within the annual report.-
 1
1 -
2
-
3
-
4
-
5
-
6
-
7
-
8
-
9
-
10
-
11
-
12
-
13
-
14
-
15
-
16
-
 17
17 -
 18
18 -
 19
19 -
 20
20 -
 21
21 -
 22
22 -
 23
23 -
 24
24 -
 25
25 -
 26
26 -
 27
27 -
 28
28 -
 29
29 -
 30
30 -
 31
31 -
 32
32 -
 33
33 -
 34
34 -
 35
35 -
 36
36 -
 37
37 -
38
-
39
-
40
-
41
-
42
-
43
-
44
-
45
-
46
-
47
-
48
-
49
-
50
-
51
-
52
-
53
-
54
-
55
-
56
-
57
-
58
-
59
-
60
-
61
-
62
-
63
-
64
-
65
-
66
-
67
-
68
-
69
-
70
-
71
-
72
-
73
-
74
-
75
-
76
-
77
-
78
-
79
-
80
-
81
-
82
-
83
-
84
-
85
-
86
-
87
-
88
-
89
-
90
-
91
-
92
-
93
-
94
-
95
-
96
-
97
-
98
-
99
-
100
-
101
-
102
-
103
-
104
-
105
-
106
-
107
-
108
-
109
-
110
-
111
-
112
-
113
-
114
-
115
-
116
-
117
-
118
-
119
-
120
-
121
-
122
-
123
-
124
-
125
-
126
-
127
-
128
-
129
-
130
-
131
-
132
-
133
-
134
-
135
-
136
-
137
-
138
-
139
-
140
-
141
-
142
-
143
-
144
-
145
-
146
-
147
-
148
-
149
-
150
-
151
-
152
-
153
-
154
-
155
-
156
-
157
-
158
-
159
-
160
-
161
-
162
-
163
-
164
-
165
-
166
-
167
-
168
-
169
-
170
-
171
-
172
-
173
-
174
-
175
-
176
-
177
-
178
-
179
-
180
-
181
-
182
-
183
-
184
-
185
-
186
-
187
-
188
-
189
-
190
-
191
-
192
-
193
-
194
-
195
-
196
-
197
-
198
-
199
-
200
-
201
-
202
-
203
-
204
-
205
-
206
-
207
-
208
-
209
-
210
-
211
-
212
-
213
-
214
-
215
-
216
-
217
-
218
-
219
-
220
-
221
-
222
-
223
-
224
-
225
-
226
-
227
-
228
-
229
-
230
-
231
-
232
-
233
-
234
-
235
-
236
-
237
-
238
-
239
-
240
-
241
-
242
-
243
-
244
-
245
-
246
-
247
-
248
-
249
-
250
-
251
-
252
-
253
-
254
-
255
-
256
-
257
-
258
-
259
-
260
-
261
-
262
-
263
-
264
-
265
-
266
-
267
-
268
-
269
-
270
-
271
-
272
-
273
-
274
-
275
-
276
-
277
-
278
-
279
-
280
-
281
-
282
-
283
-
284
 |
 |

17
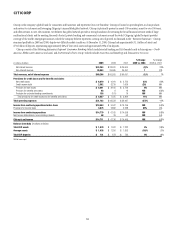
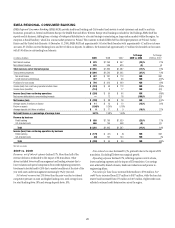
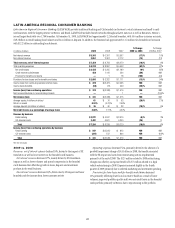
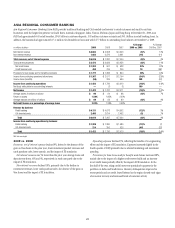
REGIONAL CONSUMER BANKING
Regional Consumer Banking (RCB) consists of Citigroup’s four regional consumer banks that provide traditional banking services to retail customers. RCB
also contains Citigroup’s branded cards business and small commercial banking business. RCB is a globally diversified business with nearly 4,000 branches in
39 countries around the world. During 2009, 68% of total RCB revenues were from outside North America. Additionally, the majority of international revenues
and loans were from emerging economies in Asia, Latin America, and Central and Eastern Europe. At year-end 2009, RCB had $213 billion of assets and
$290 billion of deposits.
In millions of dollars 2009 2008 2007
% Change
2009 vs. 2008
% Change
2008 vs. 2007
Net interest revenue $ 15,524 $ 16,230 $ 13,896 (4)% 17%
Non-interest revenue 7,247 9,444 12,747 (23) (26)
Total revenues, net of interest expense $ 22,771 $ 25,674 $ 26,643 (11)% (4)%
Total operating expenses $ 14,157 $ 22,578 $ 15,625 (37)% 44%
Net credit losses $ 5,356 $ 4,024 $ 2,390 33% 68%
Credit reserve build 1,705 2,070 902 (18) NM
Provision for benefits and claims 48 6 15 NM (60)
Provisions for loan losses and for benefits and claims $ 7,109 $ 6,100 $ 3,307 17% 84%
Income (loss) from continuing operations before taxes $ 1,505 $ (3,004) $ 7,711 NM NM
Income taxes (benefits) (386) 136 2,122 NM (94)%
Income (loss) from continuing operations $ 1,891 $ (3,140) $ 5,589 NM NM
Net income attributable to noncontrolling interests —11 18 (100)% (39)%
Net income (loss) $ 1,891 $ (3,151) $ 5,571 NM NM
Average assets (in billions of dollars) $ 196 $ 219 $ 199 (11)% 10%
Return on assets 0.96% (1.44)% 2.80%
Average deposits (in billions of dollars) $ 271 $ 267 $ 256 1% 4%
Net credit losses as a percentage of average loans 4.47% 3.15% 2.08%
Revenue by business
Retail banking $ 12,799 $ 13,700 $ 12,871 (7)% 6%
Citi-branded cards 9,972 11,974 13,772 (17) (13)
Total $ 22,771 $ 25,674 $ 26,643 (11)% (4)%
Income (loss) from continuing operations by business
Retail banking $ 2,006 $ (3,965) $ 2,400 NM NM
Citi-branded cards (115) 825 3,189 NM (74)%
Total $ 1,891 $ (3,140) $ 5,589 NM NM
NM Not meaningful