Citibank 2009 Annual Report Download - page 210
Download and view the complete annual report
Please find page 210 of the 2009 Citibank annual report below. You can navigate through the pages in the report by either clicking on the pages listed below, or by using the keyword search tool below to find specific information within the annual report.-
 1
1 -
2
-
3
-
4
-
5
-
6
-
7
-
8
-
9
-
10
-
11
-
12
-
13
-
14
-
15
-
16
-
17
-
18
-
19
-
20
-
21
-
22
-
23
-
24
-
25
-
26
-
27
-
28
-
29
-
30
-
31
-
32
-
33
-
34
-
35
-
36
-
37
-
38
-
39
-
40
-
41
-
42
-
43
-
44
-
45
-
46
-
47
-
48
-
49
-
50
-
51
-
52
-
53
-
54
-
55
-
56
-
57
-
58
-
59
-
60
-
61
-
62
-
63
-
64
-
65
-
66
-
67
-
68
-
69
-
70
-
71
-
72
-
73
-
74
-
75
-
76
-
77
-
78
-
79
-
80
-
81
-
82
-
83
-
84
-
85
-
86
-
87
-
88
-
89
-
90
-
91
-
92
-
93
-
94
-
95
-
96
-
97
-
98
-
99
-
100
-
101
-
102
-
103
-
104
-
105
-
106
-
107
-
108
-
109
-
110
-
111
-
112
-
113
-
114
-
115
-
116
-
117
-
118
-
119
-
120
-
121
-
122
-
123
-
124
-
125
-
126
-
127
-
128
-
129
-
130
-
131
-
132
-
133
-
134
-
135
-
136
-
137
-
138
-
139
-
140
-
141
-
142
-
143
-
144
-
145
-
146
-
147
-
148
-
149
-
150
-
151
-
152
-
153
-
154
-
155
-
156
-
157
-
158
-
159
-
160
-
161
-
162
-
163
-
164
-
165
-
166
-
167
-
168
-
169
-
170
-
171
-
172
-
173
-
174
-
175
-
176
-
177
-
178
-
179
-
180
-
181
-
182
-
183
-
184
-
185
-
186
-
187
-
188
-
189
-
190
-
191
-
192
-
193
-
194
-
195
-
196
-
197
-
198
-
199
-
 200
200 -
 201
201 -
 202
202 -
 203
203 -
 204
204 -
 205
205 -
 206
206 -
 207
207 -
 208
208 -
 209
209 -
 210
210 -
 211
211 -
 212
212 -
 213
213 -
 214
214 -
 215
215 -
 216
216 -
 217
217 -
 218
218 -
 219
219 -
 220
220 -
221
-
222
-
223
-
224
-
225
-
226
-
227
-
228
-
229
-
230
-
231
-
232
-
233
-
234
-
235
-
236
-
237
-
238
-
239
-
240
-
241
-
242
-
243
-
244
-
245
-
246
-
247
-
248
-
249
-
250
-
251
-
252
-
253
-
254
-
255
-
256
-
257
-
258
-
259
-
260
-
261
-
262
-
263
-
264
-
265
-
266
-
267
-
268
-
269
-
270
-
271
-
272
-
273
-
274
-
275
-
276
-
277
-
278
-
279
-
280
-
281
-
282
-
283
-
284
 |
 |

200
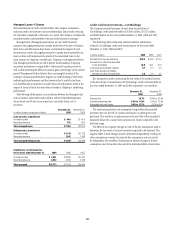
Credit Card Securitizations
The Company securitizes credit card receivables through trusts that are
established to purchase the receivables. Citigroup sells receivables into the
QSPE trusts on a non-recourse basis. Credit card securitizations are revolving
securitizations; that is, as customers pay their credit card balances, the cash
proceeds are used to purchase new receivables and replenish the receivables
in the trust. The Company relies on securitizations to fund a significant
portion of its managed North America Cards business.
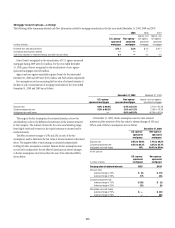
The following table reflects amounts related to the Company’s securitized
credit card receivables:
Citicorp Citi Holdings
In billions of dollars at December 31 2009 2008 2009 2008
Principal amount of credit card receivables in trusts $78.8 $78.3 $42.3 $45.7
Ownership interests in principal amount of trust credit card receivables
Sold to investors via trust-issued securities 66.5 68.2 28.2 30.0
Retained by Citigroup as trust-issued securities 5.0 1.2 10.1 5.4
Retained by Citigroup via non-certificated interests recorded as consumer loans 7.3 8.9 4.0 10.3
Total ownership interests in principal amount of trust credit card receivables $78.8 $78.3 $42.3 $45.7
Other amounts recorded on the balance sheet related to interests retained in the trusts
Other retained interests in securitized assets $ 1.4 $ 1.2 $ 1.6 $ 2.0
Residual interest in securitized assets (1) 0.3 0.3 1.2 1.4
Amounts payable to trusts 1.2 1.0 0.8 0.7
(1) 2009 balances include net unbilled interest of $0.3 billion for Citicorp and $0.4 billion for Citi Holdings. December 31, 2008 balances included net unbilled interest of $0.3 billion for Citicorp and $0.3 billion for Citi
Holdings.
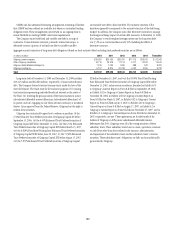
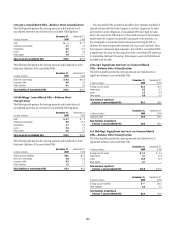
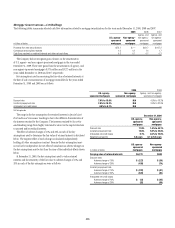
Credit Card Securitizations—Citicorp
In the years ended December 31, 2009, 2008 and 2007, the Company
recorded net gains (losses) from securitization of Citicorp’s credit card
receivables of $349 million, $(1,007) million and $416 million, respectively.
Net gains (losses) reflect the following:
incremental gains (losses) from new securitizations; •
the reversal of the allowance for loan losses associated with •
receivables sold;
net gains on replenishments of the trust assets offset by other-than-•
temporary impairments; and
changes in fair value for the portion of the residual interest classified as •
trading assets.
The following table summarizes selected cash flow information related to
Citicorp’s credit card securitizations for the years ended December 31, 2009,
2008 and 2007:
In billions of dollars 2009 2008 2007
Proceeds from new securitizations $ 16.3 $ 11.8 $ 19.3
Proceeds from collections reinvested in
new receivables 144.4 165.6 176.7
Contractual servicing fees received 1.3 1.3 1.2
Cash flows received on retained
interests and other net cash flows 3.1 3.9 5.1
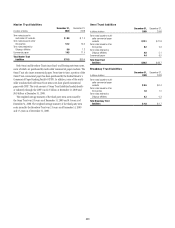
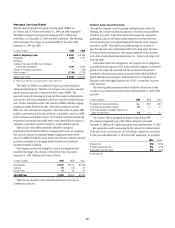
As of December 31, 2009 and December 31, 2008, the residual interest in
securitized credit card receivables was valued at $0 for Citicorp. Considering
the residual interest was written down to $0 at December 31, 2008,
key assumptions used in measuring its fair value at the date of sale or
securitization are not provided for 2009, but are provided for 2008. The below
table reflects these assumptions:
2009 2008
Discount rate N/A 13.3% to 17.4%
Constant prepayment rate N/A 5.8% to 21.1%
Anticipated net credit losses N/A 4.7% to 7.4%
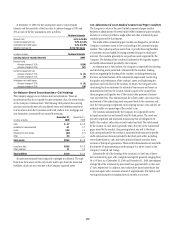
At December 31, 2009, the sensitivity of the fair value to adverse changes
of 10% and 20% in each of the key assumptions were as follows:
In millions of dollars
Residual
interest
Retained
certificates
Other
retained
interests
Carrying value of retained interests $ — $5,008 $ 1,650
Discount rates
Adverse change of 10% $ — $ (4) $ (1)
Adverse change of 20% — (8) (2)
Constant prepayment rate
Adverse change of 10% $ — $ — $ —
Adverse change of 20% — — —
Anticipated net credit losses
Adverse change of 10% $ — $ — $ (35)
Adverse change of 20% — — (69)