Citibank 2009 Annual Report Download - page 211
Download and view the complete annual report
Please find page 211 of the 2009 Citibank annual report below. You can navigate through the pages in the report by either clicking on the pages listed below, or by using the keyword search tool below to find specific information within the annual report.-
 1
1 -
2
-
3
-
4
-
5
-
6
-
7
-
8
-
9
-
10
-
11
-
12
-
13
-
14
-
15
-
16
-
17
-
18
-
19
-
20
-
21
-
22
-
23
-
24
-
25
-
26
-
27
-
28
-
29
-
30
-
31
-
32
-
33
-
34
-
35
-
36
-
37
-
38
-
39
-
40
-
41
-
42
-
43
-
44
-
45
-
46
-
47
-
48
-
49
-
50
-
51
-
52
-
53
-
54
-
55
-
56
-
57
-
58
-
59
-
60
-
61
-
62
-
63
-
64
-
65
-
66
-
67
-
68
-
69
-
70
-
71
-
72
-
73
-
74
-
75
-
76
-
77
-
78
-
79
-
80
-
81
-
82
-
83
-
84
-
85
-
86
-
87
-
88
-
89
-
90
-
91
-
92
-
93
-
94
-
95
-
96
-
97
-
98
-
99
-
100
-
101
-
102
-
103
-
104
-
105
-
106
-
107
-
108
-
109
-
110
-
111
-
112
-
113
-
114
-
115
-
116
-
117
-
118
-
119
-
120
-
121
-
122
-
123
-
124
-
125
-
126
-
127
-
128
-
129
-
130
-
131
-
132
-
133
-
134
-
135
-
136
-
137
-
138
-
139
-
140
-
141
-
142
-
143
-
144
-
145
-
146
-
147
-
148
-
149
-
150
-
151
-
152
-
153
-
154
-
155
-
156
-
157
-
158
-
159
-
160
-
161
-
162
-
163
-
164
-
165
-
166
-
167
-
168
-
169
-
170
-
171
-
172
-
173
-
174
-
175
-
176
-
177
-
178
-
179
-
180
-
181
-
182
-
183
-
184
-
185
-
186
-
187
-
188
-
189
-
190
-
191
-
192
-
193
-
194
-
195
-
196
-
197
-
198
-
199
-
200
-
 201
201 -
 202
202 -
 203
203 -
 204
204 -
 205
205 -
 206
206 -
 207
207 -
 208
208 -
 209
209 -
 210
210 -
 211
211 -
 212
212 -
 213
213 -
 214
214 -
 215
215 -
 216
216 -
 217
217 -
 218
218 -
 219
219 -
 220
220 -
 221
221 -
222
-
223
-
224
-
225
-
226
-
227
-
228
-
229
-
230
-
231
-
232
-
233
-
234
-
235
-
236
-
237
-
238
-
239
-
240
-
241
-
242
-
243
-
244
-
245
-
246
-
247
-
248
-
249
-
250
-
251
-
252
-
253
-
254
-
255
-
256
-
257
-
258
-
259
-
260
-
261
-
262
-
263
-
264
-
265
-
266
-
267
-
268
-
269
-
270
-
271
-
272
-
273
-
274
-
275
-
276
-
277
-
278
-
279
-
280
-
281
-
282
-
283
-
284
 |
 |

201
Managed Loans—Citicorp
After securitization of credit card receivables, the Company continues to
maintain credit card customer account relationships and provides servicing
for receivables transferred to the trusts. As a result, the Company considers the
securitized credit card receivables to be part of the business it manages.
Managed-basis (Managed) presentations are non-GAAP financial
measures. Managed presentations include results from both the on-balance-
sheet loans and off-balance-sheet loans, and exclude the impact of card
securitization activity. Managed presentations assume that securitized loans
have not been sold and present the results of the securitized loans in the
same manner as Citigroup's owned loans. Citigroup’s management believes
that Managed presentations provide a greater understanding of ongoing
operations and enhance comparability of those results in prior periods as
well as demonstrating the effects of unusual gains and charges in the current
period. Management further believes that a meaningful analysis of the
Company’s financial performance requires an understanding of the factors
underlying that performance and that investors find it useful to see these
non-GAAP financial measures to analyze financial performance without the
impact of unusual items that may obscure trends in Citigroup’s underlying
performance.
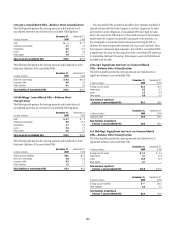
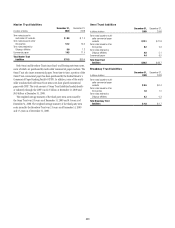
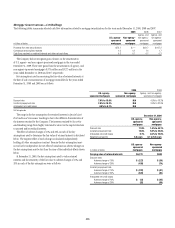
The following tables present a reconciliation between the Managed basis
and on-balance-sheet credit card portfolios and the related delinquencies
(loans which are 90 days or more past due) and credit losses, net of
recoveries.
In millions of dollars, except loans in billions
December 31,
2009
December 31,
2008
Loan amounts, at period end
On balance sheet $ 44.0 $ 45.5
Securitized amounts 71.6 69.5
Total managed loans $115.6 $ 115.0
Delinquencies, at period end
On balance sheet $ 1,146 $ 1,126
Securitized amounts 1,902 1,543
Total managed delinquencies $ 3,048 $ 2,669
Credit losses, net of recoveries,
for the years ended December 31, 2009 2008 2007
On balance sheet $ 3,841 $ 2,866 $ 1,921
Securitized amounts 6,932 4,300 2,733
Total managed $10,773 $ 7,166 $ 4,654
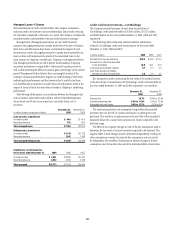
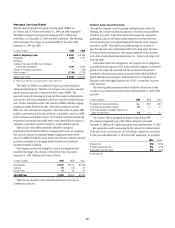
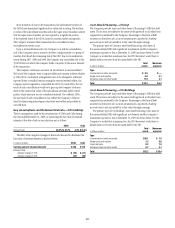
Credit Card Securitizations—Citi Holdings
The Company recorded net gains (losses) from securitization of
Citi Holdings’ credit card receivables of $(586) million, $(527) million,
and $668 million for the years ended December 31, 2009, 2008 and 2007,
respectively.
The following table summarizes selected cash flow information
related to Citi Holdings’ credit card securitizations for the years ended
December 31, 2009, 2008 and 2007:
In billions of dollars 2009 2008 2007
Proceeds from new securitizations $29.4 $16.9 $17.0
Proceeds from collections reinvested
in new receivables 46.0 49.1 41.3
Contractual servicing fees received 0.7 0.7 0.9
Cash flows received on retained
interests and other net cash flows 2.6 3.3 2.5
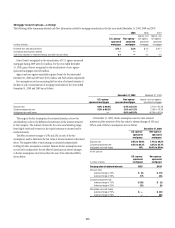
Key assumptions used in measuring the fair value of the residual interest
at the date of sale or securitization of Citi Holdings’ credit card receivables for
the years ended December 31, 2009 and 2008, respectively, are as follows:
December 31,
2009
December 31,
2008
Discount rate 19.7% 16.8% to 20.9%
Constant prepayment rate 6.0% to 11.0% 6.4% to 12.4%
Anticipated net credit losses 9.9% to 13.2% 6.6% to 9.9%
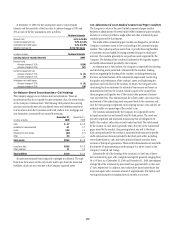
The constant prepayment rate assumption range reflects the projected
payment rates over the life of a credit card balance, excluding new card
purchases. This results in a high payment in the early life of the securitized
balances followed by a much lower payment rate, which is depicted in the
disclosed range.
The effect of two negative changes in each of the key assumptions used to
determine the fair value of retained interests is required to be disclosed. The
negative effect of each change must be calculated independently, holding all
other assumptions constant. Because the key assumptions may not in fact
be independent, the net effect of simultaneous adverse changes in the key
assumptions may be less than the sum of the individual effects shown below.