Citibank 2009 Annual Report Download - page 239
Download and view the complete annual report
Please find page 239 of the 2009 Citibank annual report below. You can navigate through the pages in the report by either clicking on the pages listed below, or by using the keyword search tool below to find specific information within the annual report.-
 1
1 -
2
-
3
-
4
-
5
-
6
-
7
-
8
-
9
-
10
-
11
-
12
-
13
-
14
-
15
-
16
-
17
-
18
-
19
-
20
-
21
-
22
-
23
-
24
-
25
-
26
-
27
-
28
-
29
-
30
-
31
-
32
-
33
-
34
-
35
-
36
-
37
-
38
-
39
-
40
-
41
-
42
-
43
-
44
-
45
-
46
-
47
-
48
-
49
-
50
-
51
-
52
-
53
-
54
-
55
-
56
-
57
-
58
-
59
-
60
-
61
-
62
-
63
-
64
-
65
-
66
-
67
-
68
-
69
-
70
-
71
-
72
-
73
-
74
-
75
-
76
-
77
-
78
-
79
-
80
-
81
-
82
-
83
-
84
-
85
-
86
-
87
-
88
-
89
-
90
-
91
-
92
-
93
-
94
-
95
-
96
-
97
-
98
-
99
-
100
-
101
-
102
-
103
-
104
-
105
-
106
-
107
-
108
-
109
-
110
-
111
-
112
-
113
-
114
-
115
-
116
-
117
-
118
-
119
-
120
-
121
-
122
-
123
-
124
-
125
-
126
-
127
-
128
-
129
-
130
-
131
-
132
-
133
-
134
-
135
-
136
-
137
-
138
-
139
-
140
-
141
-
142
-
143
-
144
-
145
-
146
-
147
-
148
-
149
-
150
-
151
-
152
-
153
-
154
-
155
-
156
-
157
-
158
-
159
-
160
-
161
-
162
-
163
-
164
-
165
-
166
-
167
-
168
-
169
-
170
-
171
-
172
-
173
-
174
-
175
-
176
-
177
-
178
-
179
-
180
-
181
-
182
-
183
-
184
-
185
-
186
-
187
-
188
-
189
-
190
-
191
-
192
-
193
-
194
-
195
-
196
-
197
-
198
-
199
-
200
-
201
-
202
-
203
-
204
-
205
-
206
-
207
-
208
-
209
-
210
-
211
-
212
-
213
-
214
-
215
-
216
-
217
-
218
-
219
-
220
-
221
-
222
-
223
-
224
-
225
-
226
-
227
-
228
-
 229
229 -
 230
230 -
 231
231 -
 232
232 -
 233
233 -
 234
234 -
 235
235 -
 236
236 -
 237
237 -
 238
238 -
 239
239 -
 240
240 -
 241
241 -
 242
242 -
 243
243 -
 244
244 -
 245
245 -
 246
246 -
 247
247 -
 248
248 -
 249
249 -
250
-
251
-
252
-
253
-
254
-
255
-
256
-
257
-
258
-
259
-
260
-
261
-
262
-
263
-
264
-
265
-
266
-
267
-
268
-
269
-
270
-
271
-
272
-
273
-
274
-
275
-
276
-
277
-
278
-
279
-
280
-
281
-
282
-
283
-
284
 |
 |

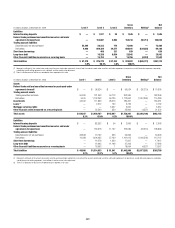
229
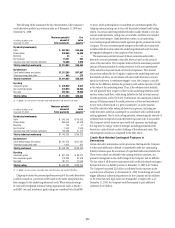
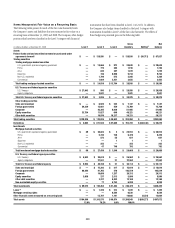
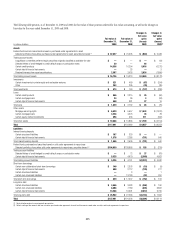
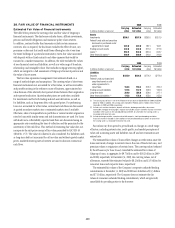
In millions of dollars at December 31, 2009 Level 1 Level 2 Level 3
Gross
inventory Netting(1)
Net
balance
Liabilities
Interest-bearing deposits $ — $ 1,517 $ 28 $ 1,545 $ — $ 1,545
Federal funds purchased and securities loaned or sold under
agreements to repurchase — 152,687 2,056 154,743 (50,713) 104,030
Trading account liabilities
Securities sold, not yet purchased 52,399 20,233 774 73,406 — 73,406
Derivatives 4,980 669,384 24,577 698,941 (634,835) 64,106
Short-term borrowings — 408 231 639 — 639
Long-term debt — 16,288 9,654 25,942 — 25,942
Other financial liabilities measured on a recurring basis — 15,753 13 15,766 (4,224) 11,542
Total liabilities $ 57,379 $ 876,270 $ 37,333 $ 970,982 $(689,772) $281,210
5.9% 90.2% 3.8% 100.0%
(1) Represents netting of: (i) the amounts due under securities purchased under agreements to resell and the amounts owed under securities sold under agreements to repurchase, and (ii) derivative exposures covered by
a qualifying master netting agreement, cash collateral, and the market value adjustment.
(2) There is no allowance for loan losses recorded for loans reported at fair value.
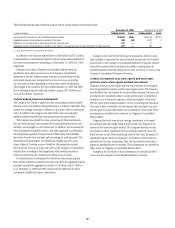
In millions of dollars at December 31, 2008 Level 1 Level 2 Level 3
Gross
inventory Netting(1)
Net
balance
Assets
Federal funds sold and securities borrowed or purchased under
agreements to resell $ — $ 96,524 $ — $ 96,524 $ (26,219) $ 70,305
Trading account assets
Trading securities and loans 90,530 121,043 50,773 262,346 — 262,346
Derivatives 9,675 1,102,252 60,725 1,172,652 (1,057,363) 115,289
Investments 44,342 111,836 28,273 184,451 — 184,451
Loans (2) — 2,572 160 2,732 — 2,732
Mortgage servicing rights — — 5,657 5,657 — 5,657
Other financial assets measured on a recurring basis — 25,540 359 25,899 (4,527) 21,372
Total assets $144,547 $1,459,767 $145,947 $1,750,261 $(1,088,109) $662,152
8.3% 83.4% 8.3% 100.0%
Liabilities
Interest-bearing deposits $ — $2,552 $ 54 $ 2,606 $ — $ 2,606
Federal funds purchased and securities loaned or sold under
agreements to repurchase — 153,918 11,167 165,085 (26,219) 138,866
Trading account liabilities
Securities sold, not yet purchased 36,848 13,192 653 50,693 — 50,693
Derivatives 10,038 1,094,435 57,139 1,161,612 (1,046,505) 115,107
Short-term borrowings — 16,278 1,329 17,607 — 17,607
Long-term debt — 16,065 11,198 27,263 — 27,263
Other financial liabilities measured on a recurring basis — 18,093 1 18,094 (4,527) 13,567
Total liabilities $ 46,886 $1,314,533 $ 81,541 $1,442,960 $(1,077,251) $365,709
3.2% 91.1% 5.7% 100.0%
(1) Represents netting of: (i) the amounts due under securities purchased under agreements to resell and the amounts owed under securities sold under agreements to repurchase, and (ii) derivative exposures covered by
a qualifying master netting agreement, cash collateral, and the market value adjustment.
(2) There is no allowance for loan losses recorded for loans reported at fair value.