Citibank 2009 Annual Report Download - page 241
Download and view the complete annual report
Please find page 241 of the 2009 Citibank annual report below. You can navigate through the pages in the report by either clicking on the pages listed below, or by using the keyword search tool below to find specific information within the annual report.-
 1
1 -
2
-
3
-
4
-
5
-
6
-
7
-
8
-
9
-
10
-
11
-
12
-
13
-
14
-
15
-
16
-
17
-
18
-
19
-
20
-
21
-
22
-
23
-
24
-
25
-
26
-
27
-
28
-
29
-
30
-
31
-
32
-
33
-
34
-
35
-
36
-
37
-
38
-
39
-
40
-
41
-
42
-
43
-
44
-
45
-
46
-
47
-
48
-
49
-
50
-
51
-
52
-
53
-
54
-
55
-
56
-
57
-
58
-
59
-
60
-
61
-
62
-
63
-
64
-
65
-
66
-
67
-
68
-
69
-
70
-
71
-
72
-
73
-
74
-
75
-
76
-
77
-
78
-
79
-
80
-
81
-
82
-
83
-
84
-
85
-
86
-
87
-
88
-
89
-
90
-
91
-
92
-
93
-
94
-
95
-
96
-
97
-
98
-
99
-
100
-
101
-
102
-
103
-
104
-
105
-
106
-
107
-
108
-
109
-
110
-
111
-
112
-
113
-
114
-
115
-
116
-
117
-
118
-
119
-
120
-
121
-
122
-
123
-
124
-
125
-
126
-
127
-
128
-
129
-
130
-
131
-
132
-
133
-
134
-
135
-
136
-
137
-
138
-
139
-
140
-
141
-
142
-
143
-
144
-
145
-
146
-
147
-
148
-
149
-
150
-
151
-
152
-
153
-
154
-
155
-
156
-
157
-
158
-
159
-
160
-
161
-
162
-
163
-
164
-
165
-
166
-
167
-
168
-
169
-
170
-
171
-
172
-
173
-
174
-
175
-
176
-
177
-
178
-
179
-
180
-
181
-
182
-
183
-
184
-
185
-
186
-
187
-
188
-
189
-
190
-
191
-
192
-
193
-
194
-
195
-
196
-
197
-
198
-
199
-
200
-
201
-
202
-
203
-
204
-
205
-
206
-
207
-
208
-
209
-
210
-
211
-
212
-
213
-
214
-
215
-
216
-
217
-
218
-
219
-
220
-
221
-
222
-
223
-
224
-
225
-
226
-
227
-
228
-
229
-
230
-
 231
231 -
 232
232 -
 233
233 -
 234
234 -
 235
235 -
 236
236 -
 237
237 -
 238
238 -
 239
239 -
 240
240 -
 241
241 -
 242
242 -
 243
243 -
 244
244 -
 245
245 -
 246
246 -
 247
247 -
 248
248 -
 249
249 -
 250
250 -
 251
251 -
252
-
253
-
254
-
255
-
256
-
257
-
258
-
259
-
260
-
261
-
262
-
263
-
264
-
265
-
266
-
267
-
268
-
269
-
270
-
271
-
272
-
273
-
274
-
275
-
276
-
277
-
278
-
279
-
280
-
281
-
282
-
283
-
284
 |
 |

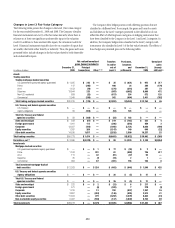
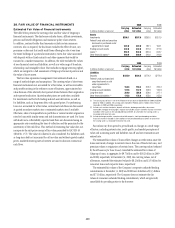
231
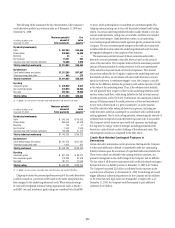
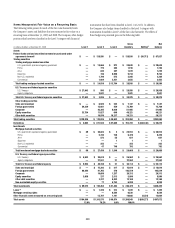
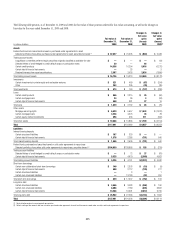
Net realized/unrealized
gains (losses) included in Transfers
in and/or
out of
Level 3
Purchases,
issuances
and
settlements
December 31,
2009
Unrealized
gains
(losses)
still held(3)
In millions of dollars
December 31,
2008
Principal
transactions Other (1) (2)
Loans $ 160 $ — $ 51 $ 7 $ (5) $ 213 $ 9
Mortgage servicing rights 5,657 — 1,543 — (670) 6,530 1,582
Other financial assets measured on a
recurring basis 359 — 305 761 (324) 1,101 215
Liabilities
Interest-bearing deposits $ 54 $ — $ 2 $ (6) $ (18) $ 28 $ (14)
Federal funds purchased and securities
loaned or sold under agreements
to repurchase 11,167 359 — (8,601) (151) 2,056 250
Trading account liabilities
Securities sold, not yet purchased 653 (11) — (180) 290 774 (52)
Short-term borrowings 1,329 (48) — (775) (371) 231 (76)
Long-term debt 11,198 (290) — (504) (1,330) 9,654 124
Other financial liabilities measured on a
recurring basis 1— (75) — (63) 13 —
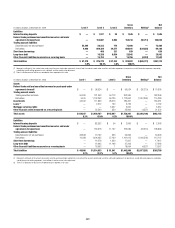
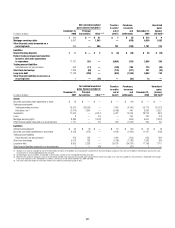
December 31,
2007
Net realized/unrealized
gains (losses) included in Transfers
in and/or
out of
Level 3
Purchases,
issuances
and
settlements
December 31,
2008
Unrealized
gains
(losses)
still held(3)
In millions of dollars
Principal
transactions Other (1) (2)
Assets
Securities purchased under agreements to resell $ 16 $ — $ — $ — $ (16) $ — $ —
Trading account assets
Trading securities and loans 75,573 (28,052) — 7,418 (4,166) 50,773 (19,572)
Derivatives, net (4) (2,470) 7,804 — (2,188) 440 3,586 9,622
Investments 17,060 — (4,917) 5,787 10,343 28,273 (801)
Loans 9 — (15) — 166 160 (19)
Mortgage servicing rights 8,380 — (1,870) — (853) 5,657 (1,870)
Other financial assets measured on a recurring basis 1,171 — 86 422 (1,320) 359 86
Liabilities
Interest-bearing deposits $ 56 $ (5) $ — $ 13 $ (20) $ 54 $ (3)
Securities sold under agreements to repurchase 6,158 (273) — 6,158 (1,422) 11,167 (136)
Trading account liabilities
Securities sold, not yet purchased 473 153 — 1,036 (703) 653 328
Short-term borrowings 5,016 106 — (1,798) (1,783) 1,329 (63)
Long-term debt 8,953 2,228 — 38,792 (34,319) 11,198 1,115
Other financial liabilities measured on a recurring basis 1 — (61) — (61) 1 —
(1) Changes in fair value for available-for-sale investments (debt securities) are recorded in Accumulated other comprehensive income, while gains and losses from sales are recorded in Realized gains (losses) from sales
of investments on the Consolidated Statement of Income.
(2) Unrealized gains (losses) on MSRs are recorded in Commissions and fees on the Consolidated Statement of Income.
(3) Represents the amount of total gains or losses for the period, included in earnings (and Accumulated other comprehensive income for changes in fair value for available-for-sale investments), attributable to the change
in fair value relating to assets and liabilities classified as Level 3 that are still held at December 31, 2009 and 2008.
(4) Total Level 3 derivative exposures have been netted in these tables for presentation purposes only.