Citibank 2009 Annual Report Download - page 56
Download and view the complete annual report
Please find page 56 of the 2009 Citibank annual report below. You can navigate through the pages in the report by either clicking on the pages listed below, or by using the keyword search tool below to find specific information within the annual report.-
 1
1 -
2
-
3
-
4
-
5
-
6
-
7
-
8
-
9
-
10
-
11
-
12
-
13
-
14
-
15
-
16
-
17
-
18
-
19
-
20
-
21
-
22
-
23
-
24
-
25
-
26
-
27
-
28
-
29
-
30
-
31
-
32
-
33
-
34
-
35
-
36
-
37
-
38
-
39
-
40
-
41
-
42
-
43
-
44
-
45
-
 46
46 -
 47
47 -
 48
48 -
 49
49 -
 50
50 -
 51
51 -
 52
52 -
 53
53 -
 54
54 -
 55
55 -
 56
56 -
 57
57 -
 58
58 -
 59
59 -
 60
60 -
 61
61 -
 62
62 -
 63
63 -
 64
64 -
 65
65 -
 66
66 -
67
-
68
-
69
-
70
-
71
-
72
-
73
-
74
-
75
-
76
-
77
-
78
-
79
-
80
-
81
-
82
-
83
-
84
-
85
-
86
-
87
-
88
-
89
-
90
-
91
-
92
-
93
-
94
-
95
-
96
-
97
-
98
-
99
-
100
-
101
-
102
-
103
-
104
-
105
-
106
-
107
-
108
-
109
-
110
-
111
-
112
-
113
-
114
-
115
-
116
-
117
-
118
-
119
-
120
-
121
-
122
-
123
-
124
-
125
-
126
-
127
-
128
-
129
-
130
-
131
-
132
-
133
-
134
-
135
-
136
-
137
-
138
-
139
-
140
-
141
-
142
-
143
-
144
-
145
-
146
-
147
-
148
-
149
-
150
-
151
-
152
-
153
-
154
-
155
-
156
-
157
-
158
-
159
-
160
-
161
-
162
-
163
-
164
-
165
-
166
-
167
-
168
-
169
-
170
-
171
-
172
-
173
-
174
-
175
-
176
-
177
-
178
-
179
-
180
-
181
-
182
-
183
-
184
-
185
-
186
-
187
-
188
-
189
-
190
-
191
-
192
-
193
-
194
-
195
-
196
-
197
-
198
-
199
-
200
-
201
-
202
-
203
-
204
-
205
-
206
-
207
-
208
-
209
-
210
-
211
-
212
-
213
-
214
-
215
-
216
-
217
-
218
-
219
-
220
-
221
-
222
-
223
-
224
-
225
-
226
-
227
-
228
-
229
-
230
-
231
-
232
-
233
-
234
-
235
-
236
-
237
-
238
-
239
-
240
-
241
-
242
-
243
-
244
-
245
-
246
-
247
-
248
-
249
-
250
-
251
-
252
-
253
-
254
-
255
-
256
-
257
-
258
-
259
-
260
-
261
-
262
-
263
-
264
-
265
-
266
-
267
-
268
-
269
-
270
-
271
-
272
-
273
-
274
-
275
-
276
-
277
-
278
-
279
-
280
-
281
-
282
-
283
-
284
 |
 |

46
As of December 31, 2009, approximately $6.7 billion of stock repurchases
remained under Citi’s authorized repurchase programs. No material
repurchases were made in 2009 or 2008. In addition, for so long as the U.S.
government holds any Citigroup common stock or trust preferred securities
acquired pursuant to the preferred stock exchange offers, Citigroup has
agreed not to acquire, repurchase, or redeem any Citigroup equity or trust
preferred securities, other than pursuant to administering its employee
benefit plans or other customary exceptions, or with the consent of the U.S.
government. See also “Supervision and Regulation.”
Tangible Common Equity
TCE, as defined by Citigroup, represents Common equity less Goodwill and
Intangible assets (other than Mortgage Servicing Rights (MSRs)) net of the
related net deferred taxes. Other companies may calculate TCE in a manner
different from that of Citigroup. Citi’s TCE was $118.2 billion and $31.1
billion at December 31, 2009 and 2008, respectively.
The TCE ratio (TCE divided by risk-weighted assets) was 10.9% and 3.1%
at December 31, 2009 and 2008, respectively.
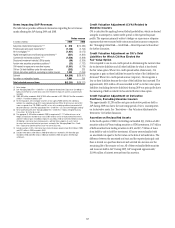
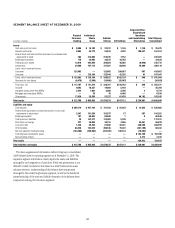
A reconciliation of Citigroup’s total stockholders’ equity to TCE follows:
In millions of dollars at year end, except ratios 2009 2008
Total Citigroup stockholders’ equity $ 152,700 $ 141,630
Less:
Preferred stock 312 70,664
Common equity $ 152,388 $ 70,966
Less:
Goodwill 25,392 27,132
Intangible assets (other than MSRs) 8,714 14,159
Related net deferred taxes 68 (1,382)
Tangible common equity (TCE) $ 118,214 $ 31,057
Tangible assets
GAAP assets $1,856,646 $1,938,470
Less:
Goodwill 25,392 27,132
Intangible assets (other than MSRs) 8,714 14,159
Related deferred tax assets 386 1,285
Tangible assets (TA) $1,822,154 $1,895,894
Risk-weighted assets (RWA) $1,088,526 $ 996,247
TCE/TA ratio 6.49% 1.64%
TCE ratio (TCE/RWA) 10.86% 3.12%
Capital Resources of Citigroup’s
Depository Institutions
Citigroup’s U.S. subsidiary depository institutions are subject to risk-based
capital guidelines issued by their respective primary federal bank regulatory
agencies, which are similar to the guidelines of the Federal Reserve Board.
To be “well capitalized” under these regulatory definitions, Citigroup’s
depository institutions must have a Tier 1 Capital ratio of at least 6%, a Total
Capital (Tier 1 Capital + Tier 2 Capital) ratio of at least 10%, and a Leverage
ratio of at least 5%, and not be subject to a regulatory directive to meet and
maintain higher capital levels.
At December 31, 2009, all of Citigroup’s subsidiary depository institutions
were “well capitalized” under federal bank regulatory agency definitions,
including Citigroup’s primary depository institution, Citibank, N.A., as noted
in the following table:
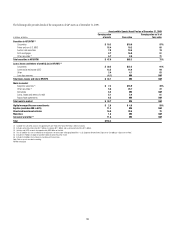
Citibank, N.A. Components of Capital and Ratios
Under Regulatory Guidelines
In billions of dollars at year end 2009 2008
Tier 1 Capital $ 96.8 $ 71.0
Total Capital (Tier 1 Capital and Tier 2 Capital) 110.6 108.4
Tier 1 Capital ratio 13.16% 9.94%
Total Capital ratio 15.03 15.18
Leverage ratio (1) 8.31 5.82
(1) Tier 1 Capital divided by each period’s quarterly adjusted average total assets.
Citibank, N.A. had a $2.8 billion net loss for 2009. In addition, during
2009, Citibank, N.A. received capital contributions from its immediate parent
company, Citicorp, in the amount of $33.0 billion. Total subordinated notes
issued to Citibank, N.A.’s immediate parent company, Citicorp, included
in Citibank, N.A.’s Tier 2 Capital declined from $28.2 billion outstanding
at December 31, 2008 to $4.0 billion outstanding at December 31, 2009,
reflecting the redemption of $24.2 billion of subordinated notes during 2009.