Citibank 2009 Annual Report Download - page 77
Download and view the complete annual report
Please find page 77 of the 2009 Citibank annual report below. You can navigate through the pages in the report by either clicking on the pages listed below, or by using the keyword search tool below to find specific information within the annual report.-
 1
1 -
2
-
3
-
4
-
5
-
6
-
7
-
8
-
9
-
10
-
11
-
12
-
13
-
14
-
15
-
16
-
17
-
18
-
19
-
20
-
21
-
22
-
23
-
24
-
25
-
26
-
27
-
28
-
29
-
30
-
31
-
32
-
33
-
34
-
35
-
36
-
37
-
38
-
39
-
40
-
41
-
42
-
43
-
44
-
45
-
46
-
47
-
48
-
49
-
50
-
51
-
52
-
53
-
54
-
55
-
56
-
57
-
58
-
59
-
60
-
61
-
62
-
63
-
64
-
65
-
66
-
 67
67 -
 68
68 -
 69
69 -
 70
70 -
 71
71 -
 72
72 -
 73
73 -
 74
74 -
 75
75 -
 76
76 -
 77
77 -
 78
78 -
 79
79 -
 80
80 -
 81
81 -
 82
82 -
 83
83 -
 84
84 -
 85
85 -
 86
86 -
 87
87 -
88
-
89
-
90
-
91
-
92
-
93
-
94
-
95
-
96
-
97
-
98
-
99
-
100
-
101
-
102
-
103
-
104
-
105
-
106
-
107
-
108
-
109
-
110
-
111
-
112
-
113
-
114
-
115
-
116
-
117
-
118
-
119
-
120
-
121
-
122
-
123
-
124
-
125
-
126
-
127
-
128
-
129
-
130
-
131
-
132
-
133
-
134
-
135
-
136
-
137
-
138
-
139
-
140
-
141
-
142
-
143
-
144
-
145
-
146
-
147
-
148
-
149
-
150
-
151
-
152
-
153
-
154
-
155
-
156
-
157
-
158
-
159
-
160
-
161
-
162
-
163
-
164
-
165
-
166
-
167
-
168
-
169
-
170
-
171
-
172
-
173
-
174
-
175
-
176
-
177
-
178
-
179
-
180
-
181
-
182
-
183
-
184
-
185
-
186
-
187
-
188
-
189
-
190
-
191
-
192
-
193
-
194
-
195
-
196
-
197
-
198
-
199
-
200
-
201
-
202
-
203
-
204
-
205
-
206
-
207
-
208
-
209
-
210
-
211
-
212
-
213
-
214
-
215
-
216
-
217
-
218
-
219
-
220
-
221
-
222
-
223
-
224
-
225
-
226
-
227
-
228
-
229
-
230
-
231
-
232
-
233
-
234
-
235
-
236
-
237
-
238
-
239
-
240
-
241
-
242
-
243
-
244
-
245
-
246
-
247
-
248
-
249
-
250
-
251
-
252
-
253
-
254
-
255
-
256
-
257
-
258
-
259
-
260
-
261
-
262
-
263
-
264
-
265
-
266
-
267
-
268
-
269
-
270
-
271
-
272
-
273
-
274
-
275
-
276
-
277
-
278
-
279
-
280
-
281
-
282
-
283
-
284
 |
 |

67
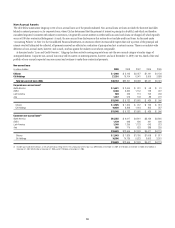
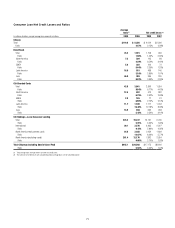
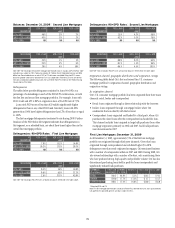
Non-Accrual Assets (continued)
The table below summarizes Citigroup’s other real estate owned (OREO) assets. This represents the carrying value of all property acquired by foreclosure or
other legal proceedings when Citi has taken possession of the collateral.
OREO 2009 2008 2007 2006 2005
Citicorp $ 148 $ 371 $ 541 $342 $209
Citi Holdings 1,341 1,022 679 358 219
Corporate/Other 11 40 8 1 1
Total OREO $1,500 $1,433 $1,228 $701 $429
North America $1,294 $1,349 $1,168 $640 $392
EMEA 121 66 40 35 21
Latin America 45 16 17 19 12
Asia 40 2 3 7 4
$1,500 $1,433 $1,228 $701 $429
Other repossessed assets (1) $ 73 $ 78 $ 99 $ 75 $ 62
(1) Primarily transportation equipment, carried at lower of cost or fair value, less costs to sell.
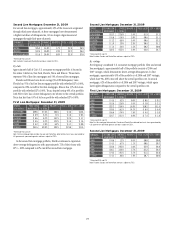
Non-accrual assets—Total Citigroup 2009 2008 2007 2006 2005
Corporate non-accrual loans $13,545 $ 9,732 $ 1,665 $ 436 $ 906
Consumer non-accrual loans 18,639 12,565 7,303 4,611 4,118
Non-accrual loans (NAL) $32,184 $22,297 $ 8,968 $5,047 $5,024
OREO $ 1,500 $ 1,433 $ 1,228 $ 701 $ 429
Other repossessed assets 73 78 99 75 62
Non-accrual assets (NAA) $33,757 $23,808 $10,295 $5,823 $5,515
NAL as a percentage of total loans 5.44% 3.21% 1.15%
NAA as a percentage of total assets 1.82% 1.23% 0.47%
Allowance for loan losses as a percentage of NAL (1)(2) 112% 133% 180%
(1) The $6.403 billion of non-accrual loans transferred from the held-for-sale portfolio to the held-for-investment portfolio during the fourth quarter of 2008 were marked-to-market at the transfer date and, therefore, no
allowance was necessary at the time of the transfer. $2.426 billion of the par value of the loans reclassified was written off prior to transfer.
(2) The allowance for loan losses includes the allowance for credit card and purchased distressed loans, while the non-accrual loans exclude credit card balances and purchased distressed loans as these continue to
accrue interest until write-off.
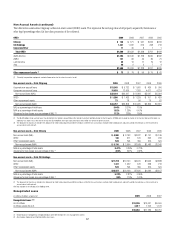
Non-accrual assets—Total Citicorp 2009 2008 2007 2006 2005
Non-accrual loans (NAL) $ 4,968 $ 3,193 $2,027 $1,141 $1,136
OREO 148 371 541 342 209
Other repossessed assets N/A N/A N/A N/A N/A
Non-accrual assets (NAA) $ 5,116 $ 3,564 $2,568 $1,483 $1,345
NAA as a percentage of total assets 0.47% 0.36% 0.21%
Allowance for loan losses as a percentage of NAL (1) 203% 241% 242%
Non-accrual assets—Total Citi Holdings
Non-accrual loans (NAL) $27,216 $19,104 $6,941 $3,906 $3,888
OREO 1,341 1,022 679 358 219
Other repossessed assets N/A N/A N/A N/A N/A
Non-accrual assets (NAA) $28,557 $20,126 $7,620 $4,264 $4,107
NAA as a percentage of total assets 5.22% 2.81% 0.86%
Allowance for loan losses as a percentage of NAL (1) 95% 115% 161%
(1) The allowance for loan losses includes the allowance for credit card and purchased distressed loans, while the non-accrual loans exclude credit card balances and purchased distressed loans as these continue to
accrue interest until write-off.
N/A Not available at the Citicorp or Citi Holdings level.
Renegotiated Loans
In millions of dollars at year end 2009 2008 2007
Renegotiated loans (1)(2)
In U.S. offices $13,246 $10,031 $5,540
In offices outside the U.S. 3,017 1,755 1,176
$16,263 $11,786 $6,716
(1) Smaller-balance, homogeneous renegotiated loans were derived from Citi’s risk management systems.
(2) Also includes Corporate and Commercial Business loans.