Citibank 2009 Annual Report Download - page 264
Download and view the complete annual report
Please find page 264 of the 2009 Citibank annual report below. You can navigate through the pages in the report by either clicking on the pages listed below, or by using the keyword search tool below to find specific information within the annual report.-
 1
1 -
2
-
3
-
4
-
5
-
6
-
7
-
8
-
9
-
10
-
11
-
12
-
13
-
14
-
15
-
16
-
17
-
18
-
19
-
20
-
21
-
22
-
23
-
24
-
25
-
26
-
27
-
28
-
29
-
30
-
31
-
32
-
33
-
34
-
35
-
36
-
37
-
38
-
39
-
40
-
41
-
42
-
43
-
44
-
45
-
46
-
47
-
48
-
49
-
50
-
51
-
52
-
53
-
54
-
55
-
56
-
57
-
58
-
59
-
60
-
61
-
62
-
63
-
64
-
65
-
66
-
67
-
68
-
69
-
70
-
71
-
72
-
73
-
74
-
75
-
76
-
77
-
78
-
79
-
80
-
81
-
82
-
83
-
84
-
85
-
86
-
87
-
88
-
89
-
90
-
91
-
92
-
93
-
94
-
95
-
96
-
97
-
98
-
99
-
100
-
101
-
102
-
103
-
104
-
105
-
106
-
107
-
108
-
109
-
110
-
111
-
112
-
113
-
114
-
115
-
116
-
117
-
118
-
119
-
120
-
121
-
122
-
123
-
124
-
125
-
126
-
127
-
128
-
129
-
130
-
131
-
132
-
133
-
134
-
135
-
136
-
137
-
138
-
139
-
140
-
141
-
142
-
143
-
144
-
145
-
146
-
147
-
148
-
149
-
150
-
151
-
152
-
153
-
154
-
155
-
156
-
157
-
158
-
159
-
160
-
161
-
162
-
163
-
164
-
165
-
166
-
167
-
168
-
169
-
170
-
171
-
172
-
173
-
174
-
175
-
176
-
177
-
178
-
179
-
180
-
181
-
182
-
183
-
184
-
185
-
186
-
187
-
188
-
189
-
190
-
191
-
192
-
193
-
194
-
195
-
196
-
197
-
198
-
199
-
200
-
201
-
202
-
203
-
204
-
205
-
206
-
207
-
208
-
209
-
210
-
211
-
212
-
213
-
214
-
215
-
216
-
217
-
218
-
219
-
220
-
221
-
222
-
223
-
224
-
225
-
226
-
227
-
228
-
229
-
230
-
231
-
232
-
233
-
234
-
235
-
236
-
237
-
238
-
239
-
240
-
241
-
242
-
243
-
244
-
245
-
246
-
247
-
248
-
249
-
250
-
251
-
252
-
253
-
 254
254 -
 255
255 -
 256
256 -
 257
257 -
 258
258 -
 259
259 -
 260
260 -
 261
261 -
 262
262 -
 263
263 -
 264
264 -
 265
265 -
 266
266 -
 267
267 -
 268
268 -
 269
269 -
 270
270 -
 271
271 -
 272
272 -
 273
273 -
 274
274 -
275
-
276
-
277
-
278
-
279
-
280
-
281
-
282
-
283
-
284
 |
 |

254
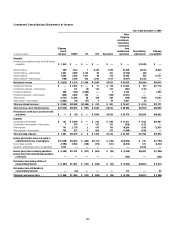
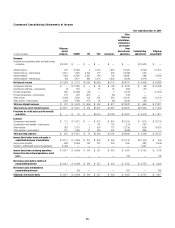
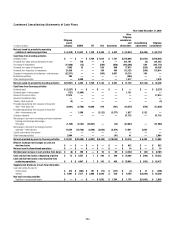
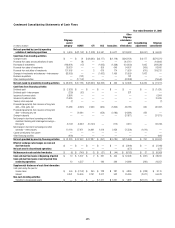
Condensed Consolidating Statements of Cash Flows
Year ended December 31, 2009
In millions of dollars
Citigroup
parent
company CGMHI CFI CCC Associates
Other
Citigroup
subsidiaries
and
eliminations
Consolidating
adjustments
Citigroup
consolidated
Net cash (used in) provided by operating
activities of continuing operations $ (5,318) $ 19,442 $ 1,238 $ 4,408 $ 4,852 $ (75,933) $(4,408) $ (55,719)
Cash flows from investing activities
Change in loans $ — $ — $ 5,759 $ 1,024 $ 1,191 $(155,601) $(1,024) $(148,651)
Proceeds from sales and securitizations of loans — 176 — 6 — 241,191 (6) 241,367
Purchases of investments (17,056) (13) — (589) (650) (263,396) 589 (281,115)
Proceeds from sales of investments 7,092 32 — 520 598 77,673 (520) 85,395
Proceeds from maturities of investments 21,030 — — 348 459 112,125 (348) 133,614
Changes in investments and advances—intercompany (22,371) — — (165) 3,657 18,714 165 —
Business acquisitions 384 — — — — (384) — —
Other investing activities — 6,259 — — — 1,417 — 7,676
Net cash (used in) provided by investing activities $(10,921) $ 6,454 $ 5,759 $ 1,144 $ 5,255 $ 31,739 $(1,144) $ 38,286
Cash flows from financing activities
Dividends paid $ (3,237) $ — $ — $ — $ — $ — $ — $ (3,237)
Dividends paid—intercompany (121) (1,000) — — — 1,121 — —
Issuance of common stock 17,514 — — — — — — 17,514
Issuance of preferred stock — — — — — — — —
Treasury stock acquired (3) — — — — — — (3)
Proceeds/(repayments) from issuance of long-term
debt—third-party, net (9,591) (2,788) 18,090 679 (791) (18,575) (679) (13,655)
Proceeds/(repayments) from issuance of long-term
debt—intercompany, net — 1,550 — (3,122) (3,377) 1,827 3,122 —
Change in deposits — — — — — 61,718 — 61,718
Net change in short-term borrowings and other investment
banking and brokerage borrowings—
third-party (1,339) (5,142) (20,847) — (10) (24,657) — (51,995)
Net change in short-term borrowings and other
advances—intercompany 10,344 (18,126) (4,240) (3,056) (5,819) 17,841 3,056 —
Capital contributions from parent — — — — — — — —
Other financing activities 2,664 — — — (41) 41 — 2,664
Net cash provided by (used in) financing activities $ 16,231 $(25,506) $ (6,997) $(5,499) $ (10,038) $ 39,316 $ 5,499 $ 13,006
Effect of exchange rate changes on cash and
due from banks $ — $ — $ — $ — $ — $ 632 $ — $ 632
Net cash used in discontinued operations $ — $ — $ — $ — $ — $ 14 $ — $ 14
Net (decrease) increase in cash and due from banks $ (8) $ 390 $ — $ 53 $ 69 $ (4,232) $ (53) $ (3,781)
Cash and due from banks at beginning of period $ 13 $ 4,557 $ 1 $ 290 $ 396 $ 24,286 $ (290) $ 29,253
Cash and due from banks at end of period from
continuing operations $ 5 $ 4,947 $ 1 $ 343 $ 465 $ 20,054 $ (343) $ 25,472
Supplemental disclosure of cash flow information
Cash paid during the year for
Income taxes $ 412 $ (663) $ 101 $ (12) $ (137) $ (2) $ 12 $ (289)
Interest $ 8,891 $ 7,311 $ 2,898 $ 3,046 $ 530 $ 8,759 $(3,046) $ 28,389
Non-cash investing activities
Transfers to repossessed assets $ — $ — $ — $ 1,642 $ 1,704 $ 1,176 $(1,642) $ 2,880