Citibank 2009 Annual Report Download - page 94
Download and view the complete annual report
Please find page 94 of the 2009 Citibank annual report below. You can navigate through the pages in the report by either clicking on the pages listed below, or by using the keyword search tool below to find specific information within the annual report.-
 1
1 -
2
-
3
-
4
-
5
-
6
-
7
-
8
-
9
-
10
-
11
-
12
-
13
-
14
-
15
-
16
-
17
-
18
-
19
-
20
-
21
-
22
-
23
-
24
-
25
-
26
-
27
-
28
-
29
-
30
-
31
-
32
-
33
-
34
-
35
-
36
-
37
-
38
-
39
-
40
-
41
-
42
-
43
-
44
-
45
-
46
-
47
-
48
-
49
-
50
-
51
-
52
-
53
-
54
-
55
-
56
-
57
-
58
-
59
-
60
-
61
-
62
-
63
-
64
-
65
-
66
-
67
-
68
-
69
-
70
-
71
-
72
-
73
-
74
-
75
-
76
-
77
-
78
-
79
-
80
-
81
-
82
-
83
-
 84
84 -
 85
85 -
 86
86 -
 87
87 -
 88
88 -
 89
89 -
 90
90 -
 91
91 -
 92
92 -
 93
93 -
 94
94 -
 95
95 -
 96
96 -
 97
97 -
 98
98 -
 99
99 -
 100
100 -
 101
101 -
 102
102 -
 103
103 -
 104
104 -
105
-
106
-
107
-
108
-
109
-
110
-
111
-
112
-
113
-
114
-
115
-
116
-
117
-
118
-
119
-
120
-
121
-
122
-
123
-
124
-
125
-
126
-
127
-
128
-
129
-
130
-
131
-
132
-
133
-
134
-
135
-
136
-
137
-
138
-
139
-
140
-
141
-
142
-
143
-
144
-
145
-
146
-
147
-
148
-
149
-
150
-
151
-
152
-
153
-
154
-
155
-
156
-
157
-
158
-
159
-
160
-
161
-
162
-
163
-
164
-
165
-
166
-
167
-
168
-
169
-
170
-
171
-
172
-
173
-
174
-
175
-
176
-
177
-
178
-
179
-
180
-
181
-
182
-
183
-
184
-
185
-
186
-
187
-
188
-
189
-
190
-
191
-
192
-
193
-
194
-
195
-
196
-
197
-
198
-
199
-
200
-
201
-
202
-
203
-
204
-
205
-
206
-
207
-
208
-
209
-
210
-
211
-
212
-
213
-
214
-
215
-
216
-
217
-
218
-
219
-
220
-
221
-
222
-
223
-
224
-
225
-
226
-
227
-
228
-
229
-
230
-
231
-
232
-
233
-
234
-
235
-
236
-
237
-
238
-
239
-
240
-
241
-
242
-
243
-
244
-
245
-
246
-
247
-
248
-
249
-
250
-
251
-
252
-
253
-
254
-
255
-
256
-
257
-
258
-
259
-
260
-
261
-
262
-
263
-
264
-
265
-
266
-
267
-
268
-
269
-
270
-
271
-
272
-
273
-
274
-
275
-
276
-
277
-
278
-
279
-
280
-
281
-
282
-
283
-
284
 |
 |

84
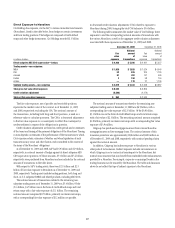
Credit Risk Mitigation
As part of its overall risk management activities, Citigroup uses credit
derivatives and other risk mitigants to hedge portions of the credit risk in its
portfolio, in addition to outright asset sales. The purpose of these transactions
is to transfer credit risk to third parties. The results of the mark-to-market
and any realized gains or losses on credit derivatives are reflected in the
Principal transactions line on the Consolidated Statement of Income.
At December 31, 2009 and 2008, $59.6 billion and $95.5 billion,
respectively, of credit risk exposure were economically hedged. Citigroup’s
expected loss model used in the calculation of its loan loss reserve does not
include the favorable impact of credit derivatives and other risk mitigants.
In addition, the reported amounts of direct outstandings and unfunded
commitments in this report do not reflect the impact of these hedging
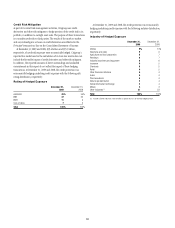
transactions. At December 31, 2009 and 2008, the credit protection was
economically hedging underlying credit exposure with the following risk
rating distribution, respectively:
Rating of Hedged Exposure
December 31,
2009
December 31,
2008
AAA/AA/A 45% 54%
BBB 37 32
BB/B 11 9
CCC or below 75
Total 100% 100%
At December 31, 2009 and 2008, the credit protection was economically
hedging underlying credit exposure with the following industry distribution,
respectively:
Industry of Hedged Exposure
December 31,
2009
December 31,
2008
Utilities 9% 10%
Telephone and cable 99
Agriculture and food preparation 87
Petroleum 67
Industrial machinery and equipment 66
Insurance 45
Chemicals 85
Retail 45
Other financial institutions 44
Autos 64
Pharmaceuticals 54
Natural gas distribution 34
Global information technology 34
Metals 43
Other industries (1) 21 23
Total 100% 100%
(1) Includes all other industries, none of which is greater than 2% of the total hedged amount.