Citibank 2009 Annual Report Download - page 178
Download and view the complete annual report
Please find page 178 of the 2009 Citibank annual report below. You can navigate through the pages in the report by either clicking on the pages listed below, or by using the keyword search tool below to find specific information within the annual report.-
 1
1 -
2
-
3
-
4
-
5
-
6
-
7
-
8
-
9
-
10
-
11
-
12
-
13
-
14
-
15
-
16
-
17
-
18
-
19
-
20
-
21
-
22
-
23
-
24
-
25
-
26
-
27
-
28
-
29
-
30
-
31
-
32
-
33
-
34
-
35
-
36
-
37
-
38
-
39
-
40
-
41
-
42
-
43
-
44
-
45
-
46
-
47
-
48
-
49
-
50
-
51
-
52
-
53
-
54
-
55
-
56
-
57
-
58
-
59
-
60
-
61
-
62
-
63
-
64
-
65
-
66
-
67
-
68
-
69
-
70
-
71
-
72
-
73
-
74
-
75
-
76
-
77
-
78
-
79
-
80
-
81
-
82
-
83
-
84
-
85
-
86
-
87
-
88
-
89
-
90
-
91
-
92
-
93
-
94
-
95
-
96
-
97
-
98
-
99
-
100
-
101
-
102
-
103
-
104
-
105
-
106
-
107
-
108
-
109
-
110
-
111
-
112
-
113
-
114
-
115
-
116
-
117
-
118
-
119
-
120
-
121
-
122
-
123
-
124
-
125
-
126
-
127
-
128
-
129
-
130
-
131
-
132
-
133
-
134
-
135
-
136
-
137
-
138
-
139
-
140
-
141
-
142
-
143
-
144
-
145
-
146
-
147
-
148
-
149
-
150
-
151
-
152
-
153
-
154
-
155
-
156
-
157
-
158
-
159
-
160
-
161
-
162
-
163
-
164
-
165
-
166
-
167
-
 168
168 -
 169
169 -
 170
170 -
 171
171 -
 172
172 -
 173
173 -
 174
174 -
 175
175 -
 176
176 -
 177
177 -
 178
178 -
 179
179 -
 180
180 -
 181
181 -
 182
182 -
 183
183 -
 184
184 -
 185
185 -
 186
186 -
 187
187 -
 188
188 -
189
-
190
-
191
-
192
-
193
-
194
-
195
-
196
-
197
-
198
-
199
-
200
-
201
-
202
-
203
-
204
-
205
-
206
-
207
-
208
-
209
-
210
-
211
-
212
-
213
-
214
-
215
-
216
-
217
-
218
-
219
-
220
-
221
-
222
-
223
-
224
-
225
-
226
-
227
-
228
-
229
-
230
-
231
-
232
-
233
-
234
-
235
-
236
-
237
-
238
-
239
-
240
-
241
-
242
-
243
-
244
-
245
-
246
-
247
-
248
-
249
-
250
-
251
-
252
-
253
-
254
-
255
-
256
-
257
-
258
-
259
-
260
-
261
-
262
-
263
-
264
-
265
-
266
-
267
-
268
-
269
-
270
-
271
-
272
-
273
-
274
-
275
-
276
-
277
-
278
-
279
-
280
-
281
-
282
-
283
-
284
 |
 |

168
The Company is currently under audit by the Internal Revenue Service
and other major taxing jurisdictions around the world. It is thus reasonably
possible that significant changes in the gross balance of unrecognized tax
benefits may occur within the next 12 months but the Company does not
expect such audits to result in amounts that would cause a significant
change to its effective tax rate, other than the following item. The Company
expects to conclude the IRS audit of its U.S. Federal consolidated income
tax returns for the years 2003-2005 within the next 12 months. The gross
uncertain tax positions at December 31, 2009 for the items expected to be
resolved is approximately $66 million plus gross interest of $10 million. The
potential tax benefit to continuing operations could be approximately $72
million.
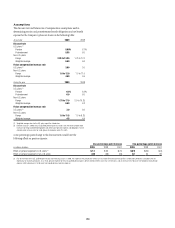
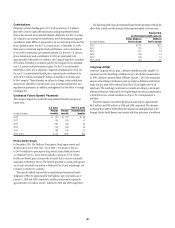
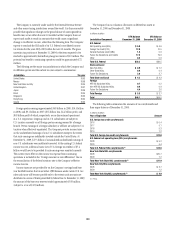
The following are the major tax jurisdictions in which the Company and
its affiliates operate and the earliest tax year subject to examination:
Jurisdiction Tax year
United States 2003
Mexico 2008
New York State and City 2005
United Kingdom 2007
Japan 2006
Brazil 2005
Singapore 2003
Hong Kong 2004
Ireland 2005
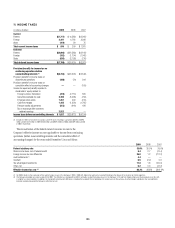
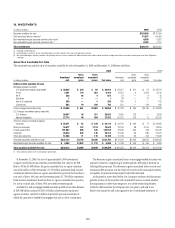
Foreign pretax earnings approximated $6.8 billion in 2009, $10.3 billion
in 2008, and $9.1 billion in 2007 ($0.6 billion loss, $4.4 billion profit, and
$0.8 billion profit of which, respectively, are in discontinued operations).
As a U.S. corporation, Citigroup and its U.S. subsidiaries are subject to
U.S. taxation currently on all foreign pretax earnings earned by a foreign
branch. Pretax earnings of a foreign subsidiary or affiliate are subject to U.S.
taxation when effectively repatriated. The Company provides income taxes
on the undistributed earnings of non-U.S. subsidiaries except to the extent
that such earnings are indefinitely invested outside the United States. At
December 31, 2009, $27.3 billion of accumulated undistributed earnings of
non-U.S. subsidiaries were indefinitely invested. At the existing U.S. federal
income tax rate, additional taxes (net of U.S. foreign tax credits) of $7.4
billion would have to be provided if such earnings were remitted currently.
The current year’s effect on the income tax expense from continuing
operations is included in the “Foreign income tax rate differential” line in
the reconciliation of the federal statutory rate to the Company’s effective
income tax rate.
Income taxes are not provided for on the Company’s savings bank base
year bad debt reserves that arose before 1988 because under current U.S. tax
rules such taxes will become payable only to the extent such amounts are
distributed in excess of limits prescribed by federal law. At December 31, 2009,
the amount of the base year reserves totaled approximately $358 million
(subject to a tax of $125 million).
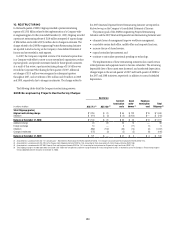
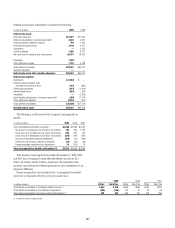
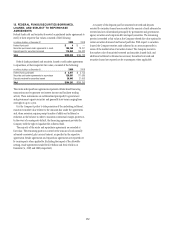
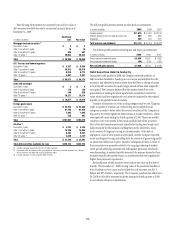
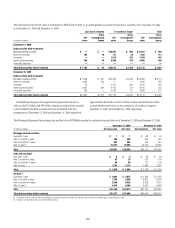
The Company has no valuation allowance on deferred tax assets at
December 31, 2009 and December 31, 2008.
In billions of dollars
Jurisdiction/Component
DTA Balance
December 31, 2009
DTA Balance
December 31, 2008
U.S. Federal
Net Operating Loss (NOL) $ 5.8 $ 4.6
Foreign Tax Credit (FTC) 12.0 10.5
General Business Credit (GBC) 1.2 0.6
Future Tax Deductions and Credits 17.5 19.9
Other 0.5 0.9
Total U.S. Federal $36.3 $36.5
State and Local
New York NOLs $ 0.9 $ 1.2
Other State NOLs 0.4 0.4
Future Tax Deductions 3.0 2.7
Total State and Local $ 4.3 $ 4.3
Foreign
APB 23 Subsidiary NOLs 0.7 0.2
Non-APB 23 Subsidiary NOLs 0.4 0.9
Future Tax Deductions 4.4 2.6
Total Foreign $ 5.5 $ 3.7
Total $46.1 $44.5
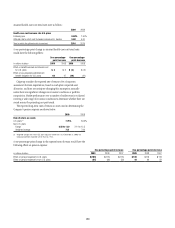
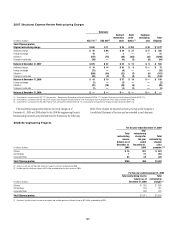
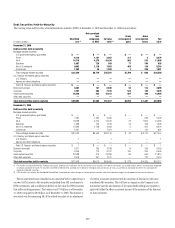
The following table summarizes the amounts of tax carryforwards and
their expiry dates as of December 31, 2009:
In billions of dollars
Year of Expiration Amount
U.S. foreign tax credit carryforwards
2016 $ 0.4
2017 5.1
2018 5.3
2019 1.2
Total U.S. foreign tax credit carryforwards $12.0
U.S. Federal net operating loss (NOL) carryforwards
2028 $ 9.2
2029 5.4
Total U.S. Federal NOL carryforwards (1) $14.6
New York State NOL carryforwards
2028 $10.7
2029 1.2
Total New York State NOL carryforwards (1) $11.9
New York City NOL carryforwards
2028 $ 3.7
2029 1.2
Total New York City NOL carryforwards (1) $ 4.9
(1) Pretax.