Citibank 2009 Annual Report Download - page 186
Download and view the complete annual report
Please find page 186 of the 2009 Citibank annual report below. You can navigate through the pages in the report by either clicking on the pages listed below, or by using the keyword search tool below to find specific information within the annual report.-
 1
1 -
2
-
3
-
4
-
5
-
6
-
7
-
8
-
9
-
10
-
11
-
12
-
13
-
14
-
15
-
16
-
17
-
18
-
19
-
20
-
21
-
22
-
23
-
24
-
25
-
26
-
27
-
28
-
29
-
30
-
31
-
32
-
33
-
34
-
35
-
36
-
37
-
38
-
39
-
40
-
41
-
42
-
43
-
44
-
45
-
46
-
47
-
48
-
49
-
50
-
51
-
52
-
53
-
54
-
55
-
56
-
57
-
58
-
59
-
60
-
61
-
62
-
63
-
64
-
65
-
66
-
67
-
68
-
69
-
70
-
71
-
72
-
73
-
74
-
75
-
76
-
77
-
78
-
79
-
80
-
81
-
82
-
83
-
84
-
85
-
86
-
87
-
88
-
89
-
90
-
91
-
92
-
93
-
94
-
95
-
96
-
97
-
98
-
99
-
100
-
101
-
102
-
103
-
104
-
105
-
106
-
107
-
108
-
109
-
110
-
111
-
112
-
113
-
114
-
115
-
116
-
117
-
118
-
119
-
120
-
121
-
122
-
123
-
124
-
125
-
126
-
127
-
128
-
129
-
130
-
131
-
132
-
133
-
134
-
135
-
136
-
137
-
138
-
139
-
140
-
141
-
142
-
143
-
144
-
145
-
146
-
147
-
148
-
149
-
150
-
151
-
152
-
153
-
154
-
155
-
156
-
157
-
158
-
159
-
160
-
161
-
162
-
163
-
164
-
165
-
166
-
167
-
168
-
169
-
170
-
171
-
172
-
173
-
174
-
175
-
 176
176 -
 177
177 -
 178
178 -
 179
179 -
 180
180 -
 181
181 -
 182
182 -
 183
183 -
 184
184 -
 185
185 -
 186
186 -
 187
187 -
 188
188 -
 189
189 -
 190
190 -
 191
191 -
 192
192 -
 193
193 -
 194
194 -
 195
195 -
 196
196 -
197
-
198
-
199
-
200
-
201
-
202
-
203
-
204
-
205
-
206
-
207
-
208
-
209
-
210
-
211
-
212
-
213
-
214
-
215
-
216
-
217
-
218
-
219
-
220
-
221
-
222
-
223
-
224
-
225
-
226
-
227
-
228
-
229
-
230
-
231
-
232
-
233
-
234
-
235
-
236
-
237
-
238
-
239
-
240
-
241
-
242
-
243
-
244
-
245
-
246
-
247
-
248
-
249
-
250
-
251
-
252
-
253
-
254
-
255
-
256
-
257
-
258
-
259
-
260
-
261
-
262
-
263
-
264
-
265
-
266
-
267
-
268
-
269
-
270
-
271
-
272
-
273
-
274
-
275
-
276
-
277
-
278
-
279
-
280
-
281
-
282
-
283
-
284
 |
 |

176
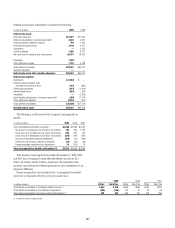
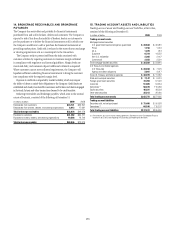
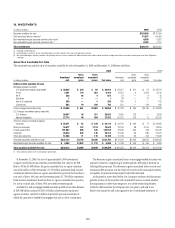
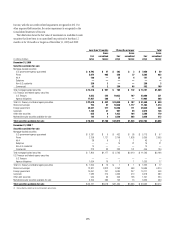
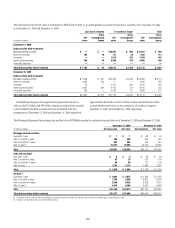
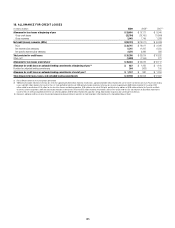
The following table presents the amortized cost and fair value of
debt securities available-for-sale by contractual maturity dates as of
December 31, 2009:
In millions of dollars
Amortized
cost Fair value
Mortgage-backed securities (1)
Due within 1 year $ 2 $ 3
After 1 but within 5 years 16 16
After 5 but within 10 years 626 597
After 10 years (2) 28,952 28,452
Total $ 29,596 $ 29,068
U.S. Treasury and federal agencies
Due within 1 year $ 5,357 $ 5,366
After 1 but within 5 years 35,912 35,618
After 5 but within 10 years 8,815 8,773
After 10 years (2) 4,487 4,357
Total $ 54,571 $ 54,114
State and municipal
Due within 1 year $ 7 $ 8
After 1 but within 5 years 119 129
After 5 but within 10 years 340 359
After 10 years (2) 16,211 15,114
Total $ 16,677 $ 15,610
Foreign government
Due within 1 year $ 32,223 $ 32,365
After 1 but within 5 years 61,165 61,426
After 5 but within 10 years 7,844 7,845
After 10 years (2) 755 883
Total $101,987 $102,519
All other (3)
Due within 1 year $ 4,243 $ 4,244
After 1 but within 5 years 14,286 14,494
After 5 but within 10 years 9,483 9,597
After 10 years (2) 4,280 4,147
Total $ 32,292 $ 32,482
Total debt securities available-for-sale $235,123 $233,793
(1) Includes mortgage-backed securities of U.S. federal agencies.
(2) Investments with no stated maturities are included as contractual maturities of greater than 10 years.
Actual maturities may differ due to call or prepayment rights.
(3) Includes corporate securities and other debt securities.
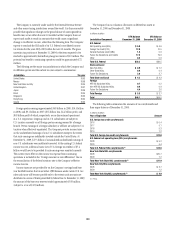
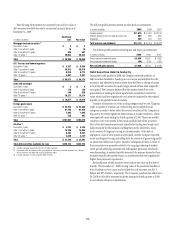
The following table presents interest and dividends on investments:
In millions of dollars 2009 2008 2007
Taxable interest $ 11,970 $ 9,407 $ 12,169
Interest exempt from U.S. federal income tax 864 836 897
Dividends 285 475 357
Total interest and dividends $13,119 $ 10,718 $ 13,423
The following table presents realized gains and losses on investments:
In millions of dollars 2009 2008 2007
Gross realized investment gains $ 2,090 $ 837 $ 1,435
Gross realized investment losses (94) (158) (267)
Net realized gains (losses) $ 1,996 $ 679 $ 1,168
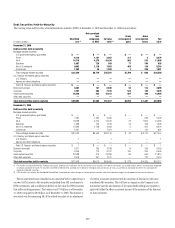
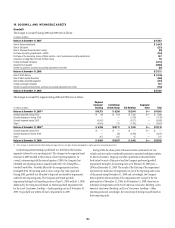
Debt Securities Held-to-Maturity
During the fourth quarter of 2008, the Company reviewed portfolios of
debt securities classified in Trading account assets and available-for-sale
securities, and identified positions where there had been a change of intent
to hold the debt securities for much longer periods of time than originally
anticipated. The Company believed that the expected cash flows to be
generated from holding the assets significantly exceed their current fair
value, which had been significantly and adversely impacted by the reduced
liquidity in the global financial markets.
Transfers of securities out of the trading category must be rare. Citigroup
made a number of transfers out of the trading and available-for-sale
categories in order to better reflect the revised intentions of the Company in
response to the recent significant deterioration in market conditions, which
were especially acute during the fourth quarter of 2008. These rare market
conditions were not foreseen at the initial purchase date of the securities.
Most of the debt securities previously classified as trading were bought and
held principally for the purpose of selling them in the short term, many
in the context of Citigroup’s acting as a market maker. At the date of
acquisition, most of these positions were liquid, and the Company expected
active and frequent buying and selling with the objective of generating profits
on short-term differences in price. However, subsequent declines in value of
these securities were primarily related to the ongoing widening of market
credit spreads reflecting increased risk and liquidity premiums that buyers
were demanding. As market liquidity decreased, the primary buyers for these
securities typically demanded returns on investments that were significantly
higher than previously experienced.
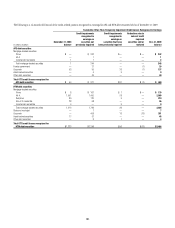
Reclassification of debt securities were made at fair value on the date of
transfer. The December 31, 2008 carrying value of the securities transferred
from Trading account assets and available-for-sale securities was $33.3
billion and $27.0 billion, respectively. The Company purchased an additional
$4.2 billion of held-to-maturity securities during the fourth quarter of 2008,
in accordance with prior commitments.