Citibank 2009 Annual Report Download - page 55
Download and view the complete annual report
Please find page 55 of the 2009 Citibank annual report below. You can navigate through the pages in the report by either clicking on the pages listed below, or by using the keyword search tool below to find specific information within the annual report.-
 1
1 -
2
-
3
-
4
-
5
-
6
-
7
-
8
-
9
-
10
-
11
-
12
-
13
-
14
-
15
-
16
-
17
-
18
-
19
-
20
-
21
-
22
-
23
-
24
-
25
-
26
-
27
-
28
-
29
-
30
-
31
-
32
-
33
-
34
-
35
-
36
-
37
-
38
-
39
-
40
-
41
-
42
-
43
-
44
-
 45
45 -
 46
46 -
 47
47 -
 48
48 -
 49
49 -
 50
50 -
 51
51 -
 52
52 -
 53
53 -
 54
54 -
 55
55 -
 56
56 -
 57
57 -
 58
58 -
 59
59 -
 60
60 -
 61
61 -
 62
62 -
 63
63 -
 64
64 -
 65
65 -
66
-
67
-
68
-
69
-
70
-
71
-
72
-
73
-
74
-
75
-
76
-
77
-
78
-
79
-
80
-
81
-
82
-
83
-
84
-
85
-
86
-
87
-
88
-
89
-
90
-
91
-
92
-
93
-
94
-
95
-
96
-
97
-
98
-
99
-
100
-
101
-
102
-
103
-
104
-
105
-
106
-
107
-
108
-
109
-
110
-
111
-
112
-
113
-
114
-
115
-
116
-
117
-
118
-
119
-
120
-
121
-
122
-
123
-
124
-
125
-
126
-
127
-
128
-
129
-
130
-
131
-
132
-
133
-
134
-
135
-
136
-
137
-
138
-
139
-
140
-
141
-
142
-
143
-
144
-
145
-
146
-
147
-
148
-
149
-
150
-
151
-
152
-
153
-
154
-
155
-
156
-
157
-
158
-
159
-
160
-
161
-
162
-
163
-
164
-
165
-
166
-
167
-
168
-
169
-
170
-
171
-
172
-
173
-
174
-
175
-
176
-
177
-
178
-
179
-
180
-
181
-
182
-
183
-
184
-
185
-
186
-
187
-
188
-
189
-
190
-
191
-
192
-
193
-
194
-
195
-
196
-
197
-
198
-
199
-
200
-
201
-
202
-
203
-
204
-
205
-
206
-
207
-
208
-
209
-
210
-
211
-
212
-
213
-
214
-
215
-
216
-
217
-
218
-
219
-
220
-
221
-
222
-
223
-
224
-
225
-
226
-
227
-
228
-
229
-
230
-
231
-
232
-
233
-
234
-
235
-
236
-
237
-
238
-
239
-
240
-
241
-
242
-
243
-
244
-
245
-
246
-
247
-
248
-
249
-
250
-
251
-
252
-
253
-
254
-
255
-
256
-
257
-
258
-
259
-
260
-
261
-
262
-
263
-
264
-
265
-
266
-
267
-
268
-
269
-
270
-
271
-
272
-
273
-
274
-
275
-
276
-
277
-
278
-
279
-
280
-
281
-
282
-
283
-
284
 |
 |

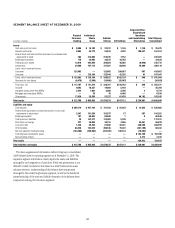
45
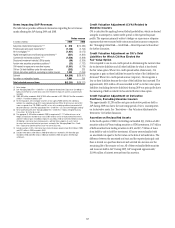
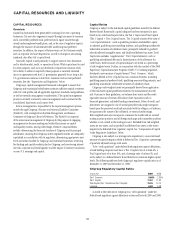
2009 Actions Significantly Impacting
Citigroup’s Capital
Primarily as a result of the preferred stock and trust preferred securities
exchange offers consummated in the third quarter of 2009, and capital raised
in connection with the $20 billion TARP repayment as well as the exiting of
the loss-sharing agreement in the fourth quarter of 2009, the overall quality
of Citigroup’s capital was enhanced, with Tier 1 Common increasing by
approximately $82 billion from December 31, 2008 to December 31, 2009.
In addition, Citigroup’s Tangible Common Equity (TCE) increased by
approximately $87 billion from December 31, 2008 to December 31, 2009.
Tier 1 Common and related capital adequacy ratios are measures used and
relied upon by U.S. banking regulators, while TCE is a capital adequacy
metric used and relied upon by industry analysts. However, both metrics
and related ratios are considered “non-GAAP financial measures” for SEC
purposes. See “Capital Ratios,” “Components of Capital Under Regulatory
Guidelines,” and “Tangible Common Equity” for additional information on
these measures.
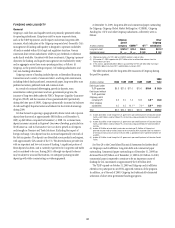
2009 Actions Significantly Impacting Citigroup’s
Risk-Weighted Assets
In the fourth quarter of 2009, Citigroup entered into an agreement to exit
the loss-sharing agreement with the U.S. Treasury, FDIC, and Federal
Reserve Bank of New York, which covered losses on a specifically designated
portfolio, principally comprised of consumer assets, and initially valued at
approximately $301 billion as of November 21, 2008. Under the agreement,
these designated assets had been risk-weighted at 20% for purposes of
calculating Citi’s risk-based capital ratios. With the exiting of the agreement,
commencing December 31, 2009, Citigroup discontinued risk-weighting these
assets at 20%. Rather, the assets were risk-weighted as required in accordance
with risk-based capital guidelines, as described above, and consistent to that
prior to entering into the agreement. The exiting of the loss-sharing
agreement increased Citigroup’s risk-weighted assets by approximately
$136 billion, and correspondingly decreased Citi’s Tier 1 Common, Tier 1
Capital, and Total Capital ratios by approximately 125 basis points,
approximately 157 basis points, and approximately 183 basis points,
respectively, at December 31, 2009.
In addition, during the first half of 2009, all three of Citigroup’s
primary credit card securitization trusts—the Master Trust, Omni Trust,
and Broadway Trust—had bonds placed on ratings watch with negative
implications by rating agencies. As a result of the ratings watch status,
certain actions were taken by Citi with respect to each of the trusts. In
general, the actions subordinated certain senior interests in the trust assets
that were retained by Citi, which effectively placed these interests below
investor interests in terms of priority of payment.
As a result of these actions, based on the applicable regulatory capital
rules, Citigroup began including the sold assets for all three of the credit card
securitization trusts in its risk-weighted assets for purposes of calculating its
risk-based capital ratios during 2009. The increase in risk-weighted assets
occurred in the quarter during 2009 in which the respective actions took
place. The effect of these changes increased Citigroup’s risk-weighted assets
by approximately $82 billion, and decreased Citigroup’s Tier 1 Capital ratio
by approximately 100 basis points each as of March 31, 2009, with respect to
the Master and Omni Trusts. The inclusion of the Broadway Trust increased
Citigroup’s risk-weighted assets by an additional approximate $900 million at
June 30, 2009. All bond ratings for each of the trusts have been affirmed by the
rating agencies, and no downgrades had occurred as of December 31, 2009.
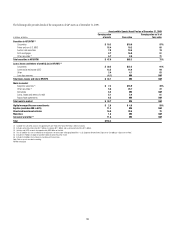
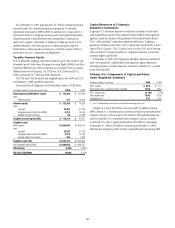
2010 Accounting Changes Significantly Impacting
Citigroup’s Capital—Elimination of Qualifying
Special Purpose Entities (QSPEs) and Changes
in the Consolidation Model for Variable Interest
Entities (VIEs)
Changes that the FASB adopted in 2009 regarding sales treatment for assets
and consolidation of off-balance-sheet VIEs, as promulgated in SFAS 166
and SFAS 167, respectively, will have a significant and immediate impact on
Citigroup’s capital ratios beginning in the first quarter of 2010. Specifically,
the pro forma impact on Citigroup’s capital ratios of the adoption on January
1, 2010 of SFAS 166 and SFAS 167 (based on financial information as of
December 31, 2009) would be as follows:
As of December 31, 2009
As reported Pro forma Impact
Tier 1 Common 9.60% 8.21% (139) bps
Tier 1 Capital 11.67 10.26 (141) bps
Total Capital 15.25 13.82 (143) bps
Leverage 6.89 6.14 (75) bps
TCE (TCE/RWA) 10.86% 9.99% (87) bps
For more information, see Notes 1 and 23 to the Consolidated Financial
Statements, including “Funding, Liquidity Facilities and Subordinate
Interests” below.
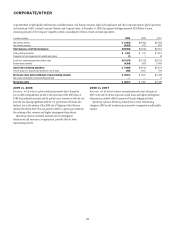
Common Stockholders’ Equity
Citigroup’s common stockholders’ equity increased during 2009 by $81.4
billion to $152.4 billion, and represented 8.2% of total assets as of December
31, 2009. Citigroup’s common stockholders’ equity was $71.0 billion, which
represented 3.7% of total assets, at December 31, 2008.
The table below summarizes the change in Citigroup’s common
stockholders’ equity during 2009:
In billions of dollars
Common stockholders’ equity, December 31, 2008 $ 71.0
Net loss (1) (2) (1.6)
Employee benefit plans and other activities 1.0
Dividends (3.4)
Exchange offers (1) 58.8
Issuance of common equity and T-DECs 20.3
Net change in accumulated other comprehensive income (loss), net of tax 6.3
Common stockholders’ equity, December 31, 2009 $152.4
(1) Net loss includes a $0.9 billion after-tax gain related to the conversion of trust preferred securities
held by public investors into common stock, pursuant to Citi’s public and private exchange offers
consummated in July 2009 and completed in their entirety in September 2009.
(2) Net loss includes a $6.2 billion after-tax loss associated with the $20 billion TARP repayment as well
as the exiting of the loss-sharing agreement in December 2009.