Citibank 2009 Annual Report Download - page 262
Download and view the complete annual report
Please find page 262 of the 2009 Citibank annual report below. You can navigate through the pages in the report by either clicking on the pages listed below, or by using the keyword search tool below to find specific information within the annual report.-
 1
1 -
2
-
3
-
4
-
5
-
6
-
7
-
8
-
9
-
10
-
11
-
12
-
13
-
14
-
15
-
16
-
17
-
18
-
19
-
20
-
21
-
22
-
23
-
24
-
25
-
26
-
27
-
28
-
29
-
30
-
31
-
32
-
33
-
34
-
35
-
36
-
37
-
38
-
39
-
40
-
41
-
42
-
43
-
44
-
45
-
46
-
47
-
48
-
49
-
50
-
51
-
52
-
53
-
54
-
55
-
56
-
57
-
58
-
59
-
60
-
61
-
62
-
63
-
64
-
65
-
66
-
67
-
68
-
69
-
70
-
71
-
72
-
73
-
74
-
75
-
76
-
77
-
78
-
79
-
80
-
81
-
82
-
83
-
84
-
85
-
86
-
87
-
88
-
89
-
90
-
91
-
92
-
93
-
94
-
95
-
96
-
97
-
98
-
99
-
100
-
101
-
102
-
103
-
104
-
105
-
106
-
107
-
108
-
109
-
110
-
111
-
112
-
113
-
114
-
115
-
116
-
117
-
118
-
119
-
120
-
121
-
122
-
123
-
124
-
125
-
126
-
127
-
128
-
129
-
130
-
131
-
132
-
133
-
134
-
135
-
136
-
137
-
138
-
139
-
140
-
141
-
142
-
143
-
144
-
145
-
146
-
147
-
148
-
149
-
150
-
151
-
152
-
153
-
154
-
155
-
156
-
157
-
158
-
159
-
160
-
161
-
162
-
163
-
164
-
165
-
166
-
167
-
168
-
169
-
170
-
171
-
172
-
173
-
174
-
175
-
176
-
177
-
178
-
179
-
180
-
181
-
182
-
183
-
184
-
185
-
186
-
187
-
188
-
189
-
190
-
191
-
192
-
193
-
194
-
195
-
196
-
197
-
198
-
199
-
200
-
201
-
202
-
203
-
204
-
205
-
206
-
207
-
208
-
209
-
210
-
211
-
212
-
213
-
214
-
215
-
216
-
217
-
218
-
219
-
220
-
221
-
222
-
223
-
224
-
225
-
226
-
227
-
228
-
229
-
230
-
231
-
232
-
233
-
234
-
235
-
236
-
237
-
238
-
239
-
240
-
241
-
242
-
243
-
244
-
245
-
246
-
247
-
248
-
249
-
250
-
251
-
 252
252 -
 253
253 -
 254
254 -
 255
255 -
 256
256 -
 257
257 -
 258
258 -
 259
259 -
 260
260 -
 261
261 -
 262
262 -
 263
263 -
 264
264 -
 265
265 -
 266
266 -
 267
267 -
 268
268 -
 269
269 -
 270
270 -
 271
271 -
 272
272 -
273
-
274
-
275
-
276
-
277
-
278
-
279
-
280
-
281
-
282
-
283
-
284
 |
 |

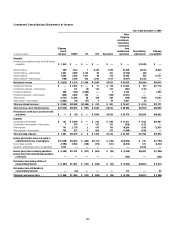
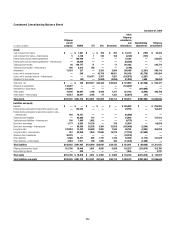
252
Condensed Consolidating Balance Sheet
December 31, 2009
In millions of dollars
Citigroup
parent
company CGMHI CFI CCC Associates
Other
Citigroup
subsidiaries
and
eliminations
Consolidating
adjustments
Citigroup
consolidated
Assets
Cash and due from banks $ — $ 1,801 $ — $ 198 $ 297 $ 23,374 $ (198) $ 25,472
Cash and due from banks—intercompany 5 3,146 1 145 168 (3,320) (145) —
Federal funds sold and resale agreements — 199,760 — — — 22,262 — 222,022
Federal funds sold and resale agreements—intercompany — 20,626 — — — (20,626) — —
Trading account assets 26 140,777 71 — 17 201,882 — 342,773
Trading account assets—intercompany 196 6,812 788 — — (7,796) — —
Investments 13,318 237 — 2,293 2,506 290,058 (2,293) 306,119
Loans, net of unearned income — 248 — 42,739 48,821 542,435 (42,739) 591,504
Loans, net of unearned income—intercompany — — 129,317 3,387 7,261 (136,578) (3,387) —
Allowance for loan losses — (83) — (3,680) (4,056) (31,894) 3,680 (36,033)
Total loans, net $ — $ 165 $129,317 $42,446 $52,026 $ 373,963 $ (42,446) $ 555,471
Advances to subsidiaries 144,497 — — — — (144,497) — —
Investments in subsidiaries 210,895 — — — — — (210,895) —
Other assets 14,196 69,907 1,186 6,440 7,317 312,183 (6,440) 404,789
Other assets—intercompany 10,412 38,047 3,168 47 1,383 (53,010) (47) —
Total assets $393,545 $481,278 $134,531 $51,569 $63,714 $ 994,473 $(262,464) $1,856,646
Liabilities and equity
Deposits $ — $ — $ — $ — $ — $ 835,903 $ — $ 835,903
Federal funds purchased and securities loaned or sold — 124,522 — — — 29,759 — 154,281
Federal funds purchased and securities loaned or sold—
intercompany 185 18,721 — — — (18,906) — —
Trading account liabilities — 82,905 115 — — 54,492 — 137,512
Trading account liabilities—intercompany 198 7,495 1,082 — — (8,775) — —
Short-term borrowings 1,177 4,593 10,136 — 379 52,594 — 68,879
Short-term borrowings—intercompany — 69,306 62,336 3,304 33,818 (165,460) (3,304) —
Long-term debt 197,804 13,422 55,499 2,893 7,542 89,752 (2,893) 364,019
Long-term debt—intercompany 367 62,050 1,039 37,600 14,278 (77,734) (37,600) —
Advances from subsidiaries 30,275 — — — — (30,275) — —
Other liabilities 5,985 70,477 585 1,772 1,742 62,290 (1,772) 141,079
Other liabilities—intercompany 4,854 7,911 198 1,080 386 (13,349) (1,080) —
Total liabilities $240,845 $461,402 $130,990 $46,649 $58,145 $ 810,291 $ (46,649) $1,701,673
Citigroup stockholders’ equity 152,700 19,448 3,541 4,920 5,569 182,337 (215,815) 152,700
Noncontrolling interest — 428 — — — 1,845 — 2,273
Total equity $152,700 $ 19,876 $ 3,541 $ 4,920 $ 5,569 $ 184,182 $(215,815) $ 154,973
Total liabilities and equity $393,545 $481,278 $134,531 $51,569 $63,714 $ 994,473 $(262,464) $1,856,646