Citibank 2009 Annual Report Download - page 78
Download and view the complete annual report
Please find page 78 of the 2009 Citibank annual report below. You can navigate through the pages in the report by either clicking on the pages listed below, or by using the keyword search tool below to find specific information within the annual report.-
 1
1 -
2
-
3
-
4
-
5
-
6
-
7
-
8
-
9
-
10
-
11
-
12
-
13
-
14
-
15
-
16
-
17
-
18
-
19
-
20
-
21
-
22
-
23
-
24
-
25
-
26
-
27
-
28
-
29
-
30
-
31
-
32
-
33
-
34
-
35
-
36
-
37
-
38
-
39
-
40
-
41
-
42
-
43
-
44
-
45
-
46
-
47
-
48
-
49
-
50
-
51
-
52
-
53
-
54
-
55
-
56
-
57
-
58
-
59
-
60
-
61
-
62
-
63
-
64
-
65
-
66
-
67
-
 68
68 -
 69
69 -
 70
70 -
 71
71 -
 72
72 -
 73
73 -
 74
74 -
 75
75 -
 76
76 -
 77
77 -
 78
78 -
 79
79 -
 80
80 -
 81
81 -
 82
82 -
 83
83 -
 84
84 -
 85
85 -
 86
86 -
 87
87 -
 88
88 -
89
-
90
-
91
-
92
-
93
-
94
-
95
-
96
-
97
-
98
-
99
-
100
-
101
-
102
-
103
-
104
-
105
-
106
-
107
-
108
-
109
-
110
-
111
-
112
-
113
-
114
-
115
-
116
-
117
-
118
-
119
-
120
-
121
-
122
-
123
-
124
-
125
-
126
-
127
-
128
-
129
-
130
-
131
-
132
-
133
-
134
-
135
-
136
-
137
-
138
-
139
-
140
-
141
-
142
-
143
-
144
-
145
-
146
-
147
-
148
-
149
-
150
-
151
-
152
-
153
-
154
-
155
-
156
-
157
-
158
-
159
-
160
-
161
-
162
-
163
-
164
-
165
-
166
-
167
-
168
-
169
-
170
-
171
-
172
-
173
-
174
-
175
-
176
-
177
-
178
-
179
-
180
-
181
-
182
-
183
-
184
-
185
-
186
-
187
-
188
-
189
-
190
-
191
-
192
-
193
-
194
-
195
-
196
-
197
-
198
-
199
-
200
-
201
-
202
-
203
-
204
-
205
-
206
-
207
-
208
-
209
-
210
-
211
-
212
-
213
-
214
-
215
-
216
-
217
-
218
-
219
-
220
-
221
-
222
-
223
-
224
-
225
-
226
-
227
-
228
-
229
-
230
-
231
-
232
-
233
-
234
-
235
-
236
-
237
-
238
-
239
-
240
-
241
-
242
-
243
-
244
-
245
-
246
-
247
-
248
-
249
-
250
-
251
-
252
-
253
-
254
-
255
-
256
-
257
-
258
-
259
-
260
-
261
-
262
-
263
-
264
-
265
-
266
-
267
-
268
-
269
-
270
-
271
-
272
-
273
-
274
-
275
-
276
-
277
-
278
-
279
-
280
-
281
-
282
-
283
-
284
 |
 |

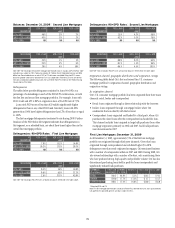
68
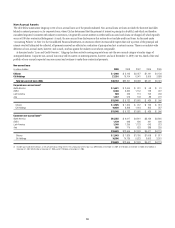
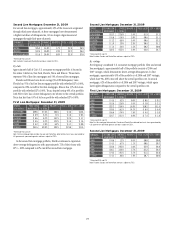
Foregone Interest Revenue on Loans (1)
In millions of dollars
In U.S.
offices
In non-
U.S.
offices
2009
total
Interest revenue that would have been accrued at
original contractual rates (2) $1,902 $1,257 $3,159
Amount recognized as interest revenue (2) 797 267 1,064
Foregone interest revenue $1,105 $ 990 $2,095
(1) Relates to corporate non-accrual, renegotiated loans and consumer loans on which accrual of interest
had been suspended.
(2) Interest revenue in offices outside the U.S. may reflect prevailing local interest rates, including the
effects of inflation and monetary correction in certain countries.
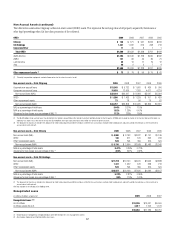
Loan Maturities and Fixed/Variable Pricing Corporate
Loans
In millions of dollars at year end
Due
within
1 year
Over 1 year
but within
5 years
Over 5
years Total
Corporate loan portfolio
maturities
In U.S. offices
Commercial and
industrial loans $ 8,661 $ 4,944 $ 3,073 $ 16,678
Financial institutions 4,516 2,577 1,602 8,695
Mortgage and real estate 10,255 5,854 3,639 19,748
Lease financing 674 384 239 1,297
Installment, revolving
credit, other 9,211 5,257 3,269 17,737
In offices outside the U.S. 56,997 30,674 17,895 105,566
Total corporate loans $90,314 $49,690 $29,717 $169,721
Fixed/variable pricing of
corporate loans with
maturities due after one
year (1)
Loans at fixed interest rates $13,702 $ 8,878
Loans at floating or adjustable
interest rates 35,988 20,839
Total $49,690 $29,717
(1) Based on contractual terms. Repricing characteristics may effectively be modified from time to time
using derivative contracts. See Note 24 to the Consolidated Financial Statements.
U.S. Consumer First and Second Residential Mortgage
Loans
In millions of dollars at year end
Due
within
1 year
Over 1 year
but within
5 years
Over 5
years Total
U.S. consumer mortgage
loan portfolio type
First mortgages $19,220 $25,544 $ 82,497 $127,262
Second mortgages 302 3,875 52,404 56,580
Total $19,522 $29,419 $134,901 $183,842
Fixed/variable pricing of
U.S. consumer
mortgage loans with
maturities due after one year
Loans at fixed interest rates $ 1,477 $ 93,604
Loans at floating or adjustable
interest rates 27,942 41,296
Total $29,419 $134,901