Citibank 2009 Annual Report Download - page 185
Download and view the complete annual report
Please find page 185 of the 2009 Citibank annual report below. You can navigate through the pages in the report by either clicking on the pages listed below, or by using the keyword search tool below to find specific information within the annual report.-
 1
1 -
2
-
3
-
4
-
5
-
6
-
7
-
8
-
9
-
10
-
11
-
12
-
13
-
14
-
15
-
16
-
17
-
18
-
19
-
20
-
21
-
22
-
23
-
24
-
25
-
26
-
27
-
28
-
29
-
30
-
31
-
32
-
33
-
34
-
35
-
36
-
37
-
38
-
39
-
40
-
41
-
42
-
43
-
44
-
45
-
46
-
47
-
48
-
49
-
50
-
51
-
52
-
53
-
54
-
55
-
56
-
57
-
58
-
59
-
60
-
61
-
62
-
63
-
64
-
65
-
66
-
67
-
68
-
69
-
70
-
71
-
72
-
73
-
74
-
75
-
76
-
77
-
78
-
79
-
80
-
81
-
82
-
83
-
84
-
85
-
86
-
87
-
88
-
89
-
90
-
91
-
92
-
93
-
94
-
95
-
96
-
97
-
98
-
99
-
100
-
101
-
102
-
103
-
104
-
105
-
106
-
107
-
108
-
109
-
110
-
111
-
112
-
113
-
114
-
115
-
116
-
117
-
118
-
119
-
120
-
121
-
122
-
123
-
124
-
125
-
126
-
127
-
128
-
129
-
130
-
131
-
132
-
133
-
134
-
135
-
136
-
137
-
138
-
139
-
140
-
141
-
142
-
143
-
144
-
145
-
146
-
147
-
148
-
149
-
150
-
151
-
152
-
153
-
154
-
155
-
156
-
157
-
158
-
159
-
160
-
161
-
162
-
163
-
164
-
165
-
166
-
167
-
168
-
169
-
170
-
171
-
172
-
173
-
174
-
 175
175 -
 176
176 -
 177
177 -
 178
178 -
 179
179 -
 180
180 -
 181
181 -
 182
182 -
 183
183 -
 184
184 -
 185
185 -
 186
186 -
 187
187 -
 188
188 -
 189
189 -
 190
190 -
 191
191 -
 192
192 -
 193
193 -
 194
194 -
 195
195 -
196
-
197
-
198
-
199
-
200
-
201
-
202
-
203
-
204
-
205
-
206
-
207
-
208
-
209
-
210
-
211
-
212
-
213
-
214
-
215
-
216
-
217
-
218
-
219
-
220
-
221
-
222
-
223
-
224
-
225
-
226
-
227
-
228
-
229
-
230
-
231
-
232
-
233
-
234
-
235
-
236
-
237
-
238
-
239
-
240
-
241
-
242
-
243
-
244
-
245
-
246
-
247
-
248
-
249
-
250
-
251
-
252
-
253
-
254
-
255
-
256
-
257
-
258
-
259
-
260
-
261
-
262
-
263
-
264
-
265
-
266
-
267
-
268
-
269
-
270
-
271
-
272
-
273
-
274
-
275
-
276
-
277
-
278
-
279
-
280
-
281
-
282
-
283
-
284
 |
 |

175
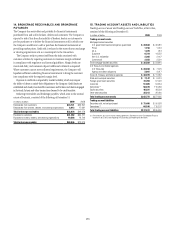
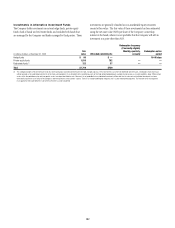
Income, with the non-credit-related impairment recognized in OCI. For
other impaired debt securities, the entire impairment is recognized in the
Consolidated Statement of Income.
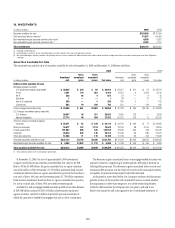
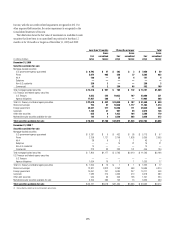
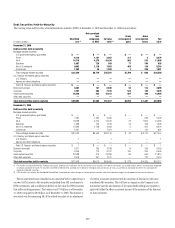
The table below shows the fair value of investments in available-for-sale
securities that have been in an unrealized loss position for less than 12
months or for 12 months or longer as of December 31, 2009 and 2008:
Less than 12 months 12 months or longer Total
In millions of dollars
Fair
value
Gross
unrealized
losses
Fair
value
Gross
unrealized
losses
Fair
value
Gross
unrealized
losses
December 31, 2009
Securities available-for-sale
Mortgage-backed securities
U.S. government-agency guaranteed $ 6,793 $ 47 $ 263 $ 3 $ 7,056 $ 50
Prime 5,074 905 228 27 5,302 932
Alt-A 106 — 35 4 141 4
Subprime — — — — — —
Non-U.S. residential 250 3 — — 250 3
Commercial 93 2 259 98 352 100
Total mortgage-backed securities $ 12,316 $ 957 $ 785 $ 132 $ 13,101 $1,089
U.S. Treasury and federal agency securities
U.S. Treasury 4,653 224 19,033 107 23,686 331
Agency obligations 17,957 208 7 — 17,964 208
Total U.S. Treasury and federal agency securities $ 22,610 $ 432 $ 19,040 $ 107 $ 41,650 $ 539
State and municipal 754 97 10,630 1,117 11,384 1,214
Foreign government 39,241 217 10,398 111 49,639 328
Corporate 1,165 47 907 99 2,072 146
Other debt securities 655 6 1,633 164 2,288 170
Marketable equity securities available-for-sale 102 4 2,526 208 2,628 212
Total securities available-for-sale $ 76,843 $1,760 $ 45,919 $1,938 $122,762 $3,698
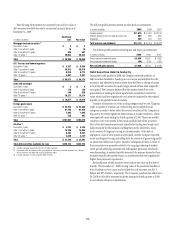
December 31, 2008 (1)
Securities available-for-sale
Mortgage-backed securities
U.S. government-agency guaranteed $ 5,281 $ 9 $ 432 $ 58 $ 5,713 $ 67
Prime 2,258 1,127 3,108 1,838 5,366 2,965
Alt-A 38 8 5 1 43 9
Subprime — — 15 21 15 21
Non-U.S. residential 10 — — — 10 —
Commercial 213 33 233 101 446 134
Total mortgage-backed securities $ 7,800 $1,177 $ 3,793 $2,019 $ 11,593 $3,196
U.S. Treasury and federal agency securities
U.S. Treasury — — — — — —
Agency obligations 1,654 76 1 1 1,655 77
Total U.S. Treasury and federal agency securities $ 1,654 $ 76 $ 1 $ 1 $ 1,655 $ 77
State and municipal 12,827 3,872 3,762 498 16,589 4,370
Foreign government 10,697 201 9,080 207 19,777 408
Corporate 1,985 270 4,393 410 6,378 680
Other debt securities 944 96 303 128 1,247 224
Marketable equity securities available-for-sale 3,254 386 102 73 3,356 459
Total securities available-for-sale $ 39,161 $6,078 $ 21,434 $3,336 $ 60,595 $9,414
(1) Reclassified to conform to the current period’s presentation.