Citibank 2009 Annual Report Download - page 176
Download and view the complete annual report
Please find page 176 of the 2009 Citibank annual report below. You can navigate through the pages in the report by either clicking on the pages listed below, or by using the keyword search tool below to find specific information within the annual report.-
 1
1 -
2
-
3
-
4
-
5
-
6
-
7
-
8
-
9
-
10
-
11
-
12
-
13
-
14
-
15
-
16
-
17
-
18
-
19
-
20
-
21
-
22
-
23
-
24
-
25
-
26
-
27
-
28
-
29
-
30
-
31
-
32
-
33
-
34
-
35
-
36
-
37
-
38
-
39
-
40
-
41
-
42
-
43
-
44
-
45
-
46
-
47
-
48
-
49
-
50
-
51
-
52
-
53
-
54
-
55
-
56
-
57
-
58
-
59
-
60
-
61
-
62
-
63
-
64
-
65
-
66
-
67
-
68
-
69
-
70
-
71
-
72
-
73
-
74
-
75
-
76
-
77
-
78
-
79
-
80
-
81
-
82
-
83
-
84
-
85
-
86
-
87
-
88
-
89
-
90
-
91
-
92
-
93
-
94
-
95
-
96
-
97
-
98
-
99
-
100
-
101
-
102
-
103
-
104
-
105
-
106
-
107
-
108
-
109
-
110
-
111
-
112
-
113
-
114
-
115
-
116
-
117
-
118
-
119
-
120
-
121
-
122
-
123
-
124
-
125
-
126
-
127
-
128
-
129
-
130
-
131
-
132
-
133
-
134
-
135
-
136
-
137
-
138
-
139
-
140
-
141
-
142
-
143
-
144
-
145
-
146
-
147
-
148
-
149
-
150
-
151
-
152
-
153
-
154
-
155
-
156
-
157
-
158
-
159
-
160
-
161
-
162
-
163
-
164
-
165
-
 166
166 -
 167
167 -
 168
168 -
 169
169 -
 170
170 -
 171
171 -
 172
172 -
 173
173 -
 174
174 -
 175
175 -
 176
176 -
 177
177 -
 178
178 -
 179
179 -
 180
180 -
 181
181 -
 182
182 -
 183
183 -
 184
184 -
 185
185 -
 186
186 -
187
-
188
-
189
-
190
-
191
-
192
-
193
-
194
-
195
-
196
-
197
-
198
-
199
-
200
-
201
-
202
-
203
-
204
-
205
-
206
-
207
-
208
-
209
-
210
-
211
-
212
-
213
-
214
-
215
-
216
-
217
-
218
-
219
-
220
-
221
-
222
-
223
-
224
-
225
-
226
-
227
-
228
-
229
-
230
-
231
-
232
-
233
-
234
-
235
-
236
-
237
-
238
-
239
-
240
-
241
-
242
-
243
-
244
-
245
-
246
-
247
-
248
-
249
-
250
-
251
-
252
-
253
-
254
-
255
-
256
-
257
-
258
-
259
-
260
-
261
-
262
-
263
-
264
-
265
-
266
-
267
-
268
-
269
-
270
-
271
-
272
-
273
-
274
-
275
-
276
-
277
-
278
-
279
-
280
-
281
-
282
-
283
-
284
 |
 |

166
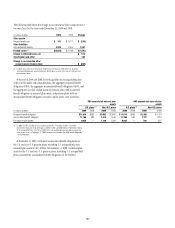
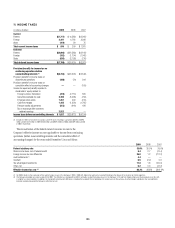
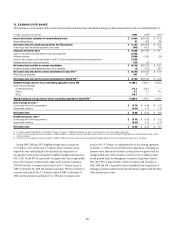
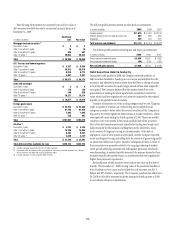
11. INCOME TAXES
In millions of dollars 2009 2008 2007
Current
Federal $(1,711) $ (4,582) $(2,260)
Foreign 3,101 4,762 3,566
State (414) 29 75
Total current income taxes $ 976 $ 209 $ 1,381
Deferred
Federal $(6,892) $(16,583) $(2,109)
Foreign (182) (1,794) (1,042)
State (635) (2,158) (776)
Total deferred income taxes $(7,709) $(20,535) $(3,927)
Provision (benefit) for income tax on
continuing operations before
noncontrolling interests (1) $(6,733
) $(20,326) $(2,546)
Provision (benefit) for income taxes on
discontinued operations (106) (79) 344
Provision (benefit) for income taxes on
cumulative effect of accounting changes — — (109)
Income tax expense (benefit) reported in
stockholders’ equity related to:
Foreign currency translation (415) (2,116) 565
Securities available-for-sale 2,765 (5,468) (759)
Employee stock plans 1,351 449 (410)
Cash flow hedges 1,165 (1,354) (1,705)
Pension liability adjustments (513) (918) 426
Tax on exchange offer booked to
retained earnings 3,523 — —
Income taxes before noncontrolling interests $ 1,037 $(29,812) $(4,194)
(1) Includes the effect of securities transactions and OTTI losses resulting in a provision (benefit) of $698
million and $(1,017) million in 2009, $238 million and $(959) million in 2008 and $409 million and $0
in 2007, respectively.
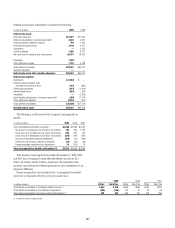
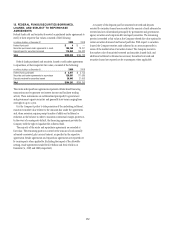
2009 2008 2007
Federal statutory rate 35.0% 35.0% 35.0%
State income taxes, net of federal benefit 8.4 2.7 (70.4)
Foreign income tax rate differential 26.0 1.2 (217.2)
Audit settlements (1) 4.4 — —
Goodwill 0.5 (2.2) 0.6
Tax advantaged investments 11.8 1.8 (100.9)
Other, net 0.2 0.3 (41.2)
Effective income tax rate (2) 86.3% 38.8% (394.1)%
(1) For 2009, relates to the conclusion of the audit of various issues in the Company’s 2003 - 2005 U.S. federal tax audit and a tax benefit relating to the release of tax reserves on interchange fees.
(2) The Company recorded an income tax benefit for 2007. The effective tax rate (benefit) of (394)% primarily resulted from pretax losses in the Company’s ICG and N.A. Regional Consumer Banking businesses (the U.S.
is a higher tax rate jurisdiction). In addition, the tax benefits of permanent differences, including the tax benefit for not providing U.S. income taxes on the earnings of certain foreign subsidiaries that are indefinitely
invested, favorably impacted the Company’s effective tax rate.
The reconciliation of the federal statutory income tax rate to the
Company’s effective income tax rate applicable to income from continuing
operations (before noncontrolling interests and the cumulative effect of
accounting changes) for the years ended December 31 was as follows: