Citibank 2009 Annual Report Download - page 102
Download and view the complete annual report
Please find page 102 of the 2009 Citibank annual report below. You can navigate through the pages in the report by either clicking on the pages listed below, or by using the keyword search tool below to find specific information within the annual report.-
 1
1 -
2
-
3
-
4
-
5
-
6
-
7
-
8
-
9
-
10
-
11
-
12
-
13
-
14
-
15
-
16
-
17
-
18
-
19
-
20
-
21
-
22
-
23
-
24
-
25
-
26
-
27
-
28
-
29
-
30
-
31
-
32
-
33
-
34
-
35
-
36
-
37
-
38
-
39
-
40
-
41
-
42
-
43
-
44
-
45
-
46
-
47
-
48
-
49
-
50
-
51
-
52
-
53
-
54
-
55
-
56
-
57
-
58
-
59
-
60
-
61
-
62
-
63
-
64
-
65
-
66
-
67
-
68
-
69
-
70
-
71
-
72
-
73
-
74
-
75
-
76
-
77
-
78
-
79
-
80
-
81
-
82
-
83
-
84
-
85
-
86
-
87
-
88
-
89
-
90
-
91
-
 92
92 -
 93
93 -
 94
94 -
 95
95 -
 96
96 -
 97
97 -
 98
98 -
 99
99 -
 100
100 -
 101
101 -
 102
102 -
 103
103 -
 104
104 -
 105
105 -
 106
106 -
 107
107 -
 108
108 -
 109
109 -
 110
110 -
 111
111 -
 112
112 -
113
-
114
-
115
-
116
-
117
-
118
-
119
-
120
-
121
-
122
-
123
-
124
-
125
-
126
-
127
-
128
-
129
-
130
-
131
-
132
-
133
-
134
-
135
-
136
-
137
-
138
-
139
-
140
-
141
-
142
-
143
-
144
-
145
-
146
-
147
-
148
-
149
-
150
-
151
-
152
-
153
-
154
-
155
-
156
-
157
-
158
-
159
-
160
-
161
-
162
-
163
-
164
-
165
-
166
-
167
-
168
-
169
-
170
-
171
-
172
-
173
-
174
-
175
-
176
-
177
-
178
-
179
-
180
-
181
-
182
-
183
-
184
-
185
-
186
-
187
-
188
-
189
-
190
-
191
-
192
-
193
-
194
-
195
-
196
-
197
-
198
-
199
-
200
-
201
-
202
-
203
-
204
-
205
-
206
-
207
-
208
-
209
-
210
-
211
-
212
-
213
-
214
-
215
-
216
-
217
-
218
-
219
-
220
-
221
-
222
-
223
-
224
-
225
-
226
-
227
-
228
-
229
-
230
-
231
-
232
-
233
-
234
-
235
-
236
-
237
-
238
-
239
-
240
-
241
-
242
-
243
-
244
-
245
-
246
-
247
-
248
-
249
-
250
-
251
-
252
-
253
-
254
-
255
-
256
-
257
-
258
-
259
-
260
-
261
-
262
-
263
-
264
-
265
-
266
-
267
-
268
-
269
-
270
-
271
-
272
-
273
-
274
-
275
-
276
-
277
-
278
-
279
-
280
-
281
-
282
-
283
-
284
 |
 |

92
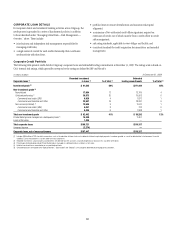
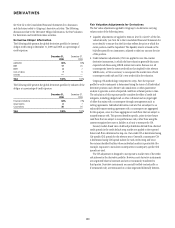
The level of price risk exposure at any given point in time depends
on the market environment and expectations of future price and market
movements, and will vary from period to period.
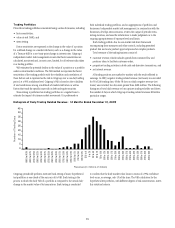
For Citigroup’s major trading centers, the aggregate pretax VAR in the
trading portfolios was $205 million at December 31, 2009 and $319 million
at December 31, 2008. Daily exposures averaged $266 million in 2009 and
ranged from $200 million to $335 million.
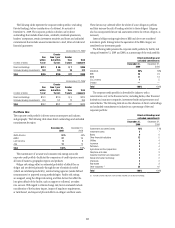
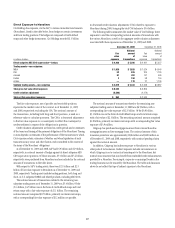
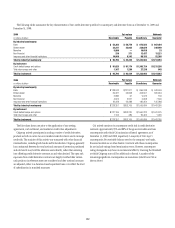
The following table summarizes VAR to Citigroup in the trading portfolios
as of December 31, 2009 and 2008, including the total VAR, the specific risk-
only component of VAR, and total—general market factors only, along with
the yearly averages:
In millions of dollars
Dec. 31,
2009
2009
average
Dec. 31,
2008
2008
average
Interest rate $ 191 $ 235 $ 320 $ 280
Foreign exchange 45 65 118 54
Equity 69 79 84 99
Commodity 18 34 15 34
Covariance adjustment (118) (147) (218) (175)
Total—all market
risk factors,
including general
and specific risk $ 205 $ 266 $ 319 $ 292
Specific risk-only
component $ 20 $ 20 $ 8 $ 21
Total—general
market factors only $ 185 $ 246 $ 311 $ 271
VAR reflects the divestiture of Phibro LLC as of December 31, 2009 (see Note 2
to the Consolidated Financial Statements). The specific risk-only component
represents the level of equity and debt issuer-specific risk embedded in VAR.
The table below provides the range of VAR in each type of trading portfolio
that was experienced during 2009 and 2008:
2009 2008
In millions of dollars Low High Low High
Interest rate $185 $320 $227 $339
Foreign exchange 18 140 23 130
Equity 46 167 58 235
Commodity 12 50 12 60
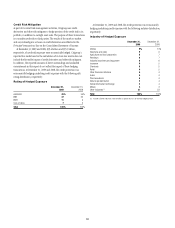
The following table provides the VAR for Citicorp’s Securities and Banking
business (ICG Citicorp VAR, which excludes Consumer) during 2009:
In millions of dollars December 31, 2009
Total—all market
risk factors,
including general
and specific risk $163
Average—during year 180
High—during year 247
Low—during year 144