Citibank 2009 Annual Report Download - page 263
Download and view the complete annual report
Please find page 263 of the 2009 Citibank annual report below. You can navigate through the pages in the report by either clicking on the pages listed below, or by using the keyword search tool below to find specific information within the annual report.-
 1
1 -
2
-
3
-
4
-
5
-
6
-
7
-
8
-
9
-
10
-
11
-
12
-
13
-
14
-
15
-
16
-
17
-
18
-
19
-
20
-
21
-
22
-
23
-
24
-
25
-
26
-
27
-
28
-
29
-
30
-
31
-
32
-
33
-
34
-
35
-
36
-
37
-
38
-
39
-
40
-
41
-
42
-
43
-
44
-
45
-
46
-
47
-
48
-
49
-
50
-
51
-
52
-
53
-
54
-
55
-
56
-
57
-
58
-
59
-
60
-
61
-
62
-
63
-
64
-
65
-
66
-
67
-
68
-
69
-
70
-
71
-
72
-
73
-
74
-
75
-
76
-
77
-
78
-
79
-
80
-
81
-
82
-
83
-
84
-
85
-
86
-
87
-
88
-
89
-
90
-
91
-
92
-
93
-
94
-
95
-
96
-
97
-
98
-
99
-
100
-
101
-
102
-
103
-
104
-
105
-
106
-
107
-
108
-
109
-
110
-
111
-
112
-
113
-
114
-
115
-
116
-
117
-
118
-
119
-
120
-
121
-
122
-
123
-
124
-
125
-
126
-
127
-
128
-
129
-
130
-
131
-
132
-
133
-
134
-
135
-
136
-
137
-
138
-
139
-
140
-
141
-
142
-
143
-
144
-
145
-
146
-
147
-
148
-
149
-
150
-
151
-
152
-
153
-
154
-
155
-
156
-
157
-
158
-
159
-
160
-
161
-
162
-
163
-
164
-
165
-
166
-
167
-
168
-
169
-
170
-
171
-
172
-
173
-
174
-
175
-
176
-
177
-
178
-
179
-
180
-
181
-
182
-
183
-
184
-
185
-
186
-
187
-
188
-
189
-
190
-
191
-
192
-
193
-
194
-
195
-
196
-
197
-
198
-
199
-
200
-
201
-
202
-
203
-
204
-
205
-
206
-
207
-
208
-
209
-
210
-
211
-
212
-
213
-
214
-
215
-
216
-
217
-
218
-
219
-
220
-
221
-
222
-
223
-
224
-
225
-
226
-
227
-
228
-
229
-
230
-
231
-
232
-
233
-
234
-
235
-
236
-
237
-
238
-
239
-
240
-
241
-
242
-
243
-
244
-
245
-
246
-
247
-
248
-
249
-
250
-
251
-
252
-
 253
253 -
 254
254 -
 255
255 -
 256
256 -
 257
257 -
 258
258 -
 259
259 -
 260
260 -
 261
261 -
 262
262 -
 263
263 -
 264
264 -
 265
265 -
 266
266 -
 267
267 -
 268
268 -
 269
269 -
 270
270 -
 271
271 -
 272
272 -
 273
273 -
274
-
275
-
276
-
277
-
278
-
279
-
280
-
281
-
282
-
283
-
284
 |
 |

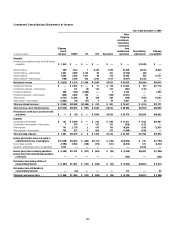
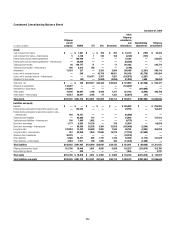
253
Condensed Consolidating Balance Sheet
December 31, 2008
In millions of dollars
Citigroup
parent
company CGMHI CFI CCC Associates
Other
Citigroup
subsidiaries
and
eliminations
Consolidating
adjustments
Citigroup
consolidated
Assets
Cash and due from banks $ — $ 3,142 $ — $ 149 $ 211 $ 25,900 $ (149) $ 29,253
Cash and due from banks—intercompany 13 1,415 1 141 185 (1,614) (141) —
Federal funds sold and resale agreements — 167,589 — — — 16,544 — 184,133
Federal funds sold and resale agreements—intercompany — 31,446 — — — (31,446) — —
Trading account assets 20 155,136 88 — 15 222,376 — 377,635
Trading account assets—intercompany 818 11,197 4,439 — 182 (16,636) — —
Investments 25,611 382 — 2,059 2,366 227,661 (2,059) 256,020
Loans, net of unearned income — 663 — 48,663 55,387 638,166 (48,663) 694,216
Loans, net of unearned income—intercompany — — 134,744 3,433 11,129 (145,873) (3,433) —
Allowance for loan losses — (122) — (3,415) (3,649) (25,845) 3,415 (29,616)
Total loans, net $ — $ 541 $134,744 $48,681 $ 62,867 $ 466,448 $ (48,681) $ 664,600
Advances to subsidiaries 167,043 — — — — (167,043) — —
Investments in subsidiaries 149,424 — — — — — (149,424) —
Other assets 12,148 74,740 51 6,156 6,970 332,920 (6,156) 426,829
Other assets—intercompany 14,998 108,952 3,997 254 504 (128,451) (254) —
Total assets $370,075 $554,540 $143,320 $57,440 $73,300 $ 946,659 $(206,864) $ 1,938,470
Liabilities and stockholders’ equity
Deposits $ — $ — $ — $ — $ — $ 774,185 $ — $ 774,185
Federal funds purchased and securities loaned or sold — 165,914 — — — 39,379 — 205,293
Federal funds purchased and securities loaned or sold—
intercompany 8,673 34,007 — — — (42,680) — —
Trading account liabilities — 70,006 14 — — 95,780 — 165,800
Trading account liabilities—intercompany 732 12,751 2,660 — — (16,143) — —
Short-term borrowings 2,571 9,735 30,994 — 222 83,169 — 126,691
Short-term borrowings—intercompany — 87,432 66,615 6,360 39,637 (193,684) (6,360) —
Long-term debt 192,290 20,623 37,375 2,214 8,333 100,972 (2,214) 359,593
Long-term debt—intercompany — 60,318 878 40,722 17,655 (78,851) (40,722) —
Advances from subsidiaries 7,660 — — — — (7,660) — —
Other liabilities 7,347 75,247 854 1,907 1,808 77,630 (1,907) 162,886
Other liabilities—intercompany 9,172 10,213 232 833 332 (19,949) (833) —
Total liabilities $228,445 $546,246 $139,622 $52,036 $67,987 $ 812,148 $ (52,036) $ 1,794,448
Citigroup stockholders’ equity $141,630 $ 7,819 $ 3,698 $ 5,404 $ 5,313 $ 132,594 $(154,828) $ 141,630
Noncontrolling interest — 475 — — — 1,917 — 2,392
Total equity $141,630 $ 8,294 $ 3,698 $ 5,404 $ 5,313 $ 134,511 $(154,828) $ 144,022
Total liabilities and stockholders’ equity $370,075 $554,540 $143,320 $57,440 $ 73,300 $ 946,659 $(206,864) $ 1,938,470