Citibank 2009 Annual Report Download - page 188
Download and view the complete annual report
Please find page 188 of the 2009 Citibank annual report below. You can navigate through the pages in the report by either clicking on the pages listed below, or by using the keyword search tool below to find specific information within the annual report.-
 1
1 -
2
-
3
-
4
-
5
-
6
-
7
-
8
-
9
-
10
-
11
-
12
-
13
-
14
-
15
-
16
-
17
-
18
-
19
-
20
-
21
-
22
-
23
-
24
-
25
-
26
-
27
-
28
-
29
-
30
-
31
-
32
-
33
-
34
-
35
-
36
-
37
-
38
-
39
-
40
-
41
-
42
-
43
-
44
-
45
-
46
-
47
-
48
-
49
-
50
-
51
-
52
-
53
-
54
-
55
-
56
-
57
-
58
-
59
-
60
-
61
-
62
-
63
-
64
-
65
-
66
-
67
-
68
-
69
-
70
-
71
-
72
-
73
-
74
-
75
-
76
-
77
-
78
-
79
-
80
-
81
-
82
-
83
-
84
-
85
-
86
-
87
-
88
-
89
-
90
-
91
-
92
-
93
-
94
-
95
-
96
-
97
-
98
-
99
-
100
-
101
-
102
-
103
-
104
-
105
-
106
-
107
-
108
-
109
-
110
-
111
-
112
-
113
-
114
-
115
-
116
-
117
-
118
-
119
-
120
-
121
-
122
-
123
-
124
-
125
-
126
-
127
-
128
-
129
-
130
-
131
-
132
-
133
-
134
-
135
-
136
-
137
-
138
-
139
-
140
-
141
-
142
-
143
-
144
-
145
-
146
-
147
-
148
-
149
-
150
-
151
-
152
-
153
-
154
-
155
-
156
-
157
-
158
-
159
-
160
-
161
-
162
-
163
-
164
-
165
-
166
-
167
-
168
-
169
-
170
-
171
-
172
-
173
-
174
-
175
-
176
-
177
-
 178
178 -
 179
179 -
 180
180 -
 181
181 -
 182
182 -
 183
183 -
 184
184 -
 185
185 -
 186
186 -
 187
187 -
 188
188 -
 189
189 -
 190
190 -
 191
191 -
 192
192 -
 193
193 -
 194
194 -
 195
195 -
 196
196 -
 197
197 -
 198
198 -
199
-
200
-
201
-
202
-
203
-
204
-
205
-
206
-
207
-
208
-
209
-
210
-
211
-
212
-
213
-
214
-
215
-
216
-
217
-
218
-
219
-
220
-
221
-
222
-
223
-
224
-
225
-
226
-
227
-
228
-
229
-
230
-
231
-
232
-
233
-
234
-
235
-
236
-
237
-
238
-
239
-
240
-
241
-
242
-
243
-
244
-
245
-
246
-
247
-
248
-
249
-
250
-
251
-
252
-
253
-
254
-
255
-
256
-
257
-
258
-
259
-
260
-
261
-
262
-
263
-
264
-
265
-
266
-
267
-
268
-
269
-
270
-
271
-
272
-
273
-
274
-
275
-
276
-
277
-
278
-
279
-
280
-
281
-
282
-
283
-
284
 |
 |

178
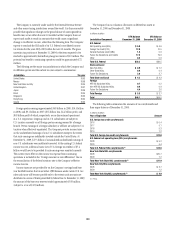
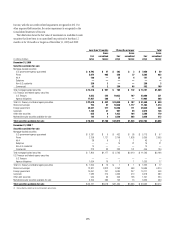
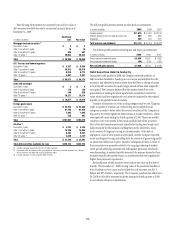
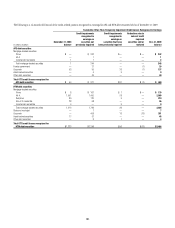
The table below shows the fair value of investments in HTM that have been in an unrecognized loss position for less than 12 months or for 12 months or longer
as of December 31, 2009 and December 31, 2008:
Less than 12 months 12 months or longer Total
In millions of dollars
Fair
value
Gross
unrecognized
losses
Fair
value
Gross
unrecognized
losses
Fair
value
Gross
unrecognized
losses
December 31, 2009
Debt securities held-to-maturity
Mortgage-backed securities $ — $ — $16,923 $ 690 $16,923 $ 690
State and municipal 755 79 713 34 1,468 113
Corporate — — 1,519 182 1,519 182
Asset-backed securities 348 18 5,460 478 5,808 496
Other debt securities — — — — — —
Total debt securities held-to-maturity $ 1,103 $ 97 $24,615 $ 1,384 $25,718 $ 1,481
December 31, 2008
Debt securities held-to-maturity
Mortgage-backed securities $ 2,348 $ 631 $ 24,236 $ 2,484 $ 26,584 $ 3,115
State and municipal 2,499 253 — — 2,499 253
Corporate 23 — 4,107 305 4,130 305
Asset-backed securities 9,051 381 4,164 174 13,215 555
Other debt securities 439 — 5,246 127 5,685 127
Total debt securities held-to-maturity $14,360 $ 1,265 $ 37,753 $ 3,090 $ 52,113 $ 4,355
Excluded from the gross unrecognized losses presented in the above
table are the $7.6 billion and $8.0 billion of gross unrealized losses recorded
in AOCI related to the HTM securities that were reclassified from AFS
investments as of December 31, 2009 and December 31, 2008, respectively.
Approximately $6.8 billion and $5.2 billion of these unrealized losses relate
to securities that have been in a loss position for 12 months or longer at
December 31, 2009 and December 31, 2008, respectively.
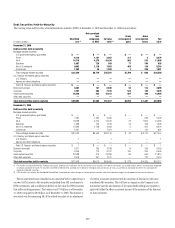
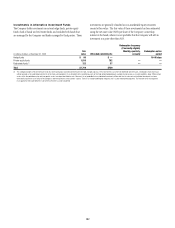
The following table presents the carrying value and fair value of HTM debt securities by contractual maturity dates as of December 31, 2009 and December 31, 2008:
December 31, 2009 December 31, 2008
In millions of dollars Carrying value Fair value Carrying value Fair value
Mortgage-backed securities
Due within 1 year $1$1 $ 88 $ 65
After 1 but within 5 years 466 385 363 282
After 5 but within 10 years 697 605 513 413
After 10 years (1) 24,337 25,589 29,155 26,287
Total $ 25,501 $ 26,580 $30,119 $27,047
State and municipal
Due within 1 year $6$6 $ 86 $ 86
After 1 but within 5 years 53 79 105 105
After 5 but within 10 years 99 99 112 106
After 10 years (1) 2,762 2,715 2,885 2,652
Total $ 2,920 $ 2,899 $ 3,188 $ 2,949
All other (2)
Due within 1 year $ 4,652 $ 4,875 $ 4,482 $ 4,505
After 1 but within 5 years 3,795 3,858 10,892 10,692
After 5 but within 10 years 6,240 6,526 6,358 6,241
After 10 years (1) 8,419 8,260 9,420 8,943
Total $ 23,106 $ 23,519 $31,152 $30,381
Total debt securities held-to-maturity $ 51,527 $ 52,998 $64,459 $60,377
(1) Investments with no stated maturities are included as contractual maturities of greater than 10 years. Actual maturities may differ due to call or prepayment rights.
(2) Includes asset-backed securities and all other debt securities.