Citibank 2009 Annual Report Download - page 243
Download and view the complete annual report
Please find page 243 of the 2009 Citibank annual report below. You can navigate through the pages in the report by either clicking on the pages listed below, or by using the keyword search tool below to find specific information within the annual report.-
 1
1 -
2
-
3
-
4
-
5
-
6
-
7
-
8
-
9
-
10
-
11
-
12
-
13
-
14
-
15
-
16
-
17
-
18
-
19
-
20
-
21
-
22
-
23
-
24
-
25
-
26
-
27
-
28
-
29
-
30
-
31
-
32
-
33
-
34
-
35
-
36
-
37
-
38
-
39
-
40
-
41
-
42
-
43
-
44
-
45
-
46
-
47
-
48
-
49
-
50
-
51
-
52
-
53
-
54
-
55
-
56
-
57
-
58
-
59
-
60
-
61
-
62
-
63
-
64
-
65
-
66
-
67
-
68
-
69
-
70
-
71
-
72
-
73
-
74
-
75
-
76
-
77
-
78
-
79
-
80
-
81
-
82
-
83
-
84
-
85
-
86
-
87
-
88
-
89
-
90
-
91
-
92
-
93
-
94
-
95
-
96
-
97
-
98
-
99
-
100
-
101
-
102
-
103
-
104
-
105
-
106
-
107
-
108
-
109
-
110
-
111
-
112
-
113
-
114
-
115
-
116
-
117
-
118
-
119
-
120
-
121
-
122
-
123
-
124
-
125
-
126
-
127
-
128
-
129
-
130
-
131
-
132
-
133
-
134
-
135
-
136
-
137
-
138
-
139
-
140
-
141
-
142
-
143
-
144
-
145
-
146
-
147
-
148
-
149
-
150
-
151
-
152
-
153
-
154
-
155
-
156
-
157
-
158
-
159
-
160
-
161
-
162
-
163
-
164
-
165
-
166
-
167
-
168
-
169
-
170
-
171
-
172
-
173
-
174
-
175
-
176
-
177
-
178
-
179
-
180
-
181
-
182
-
183
-
184
-
185
-
186
-
187
-
188
-
189
-
190
-
191
-
192
-
193
-
194
-
195
-
196
-
197
-
198
-
199
-
200
-
201
-
202
-
203
-
204
-
205
-
206
-
207
-
208
-
209
-
210
-
211
-
212
-
213
-
214
-
215
-
216
-
217
-
218
-
219
-
220
-
221
-
222
-
223
-
224
-
225
-
226
-
227
-
228
-
229
-
230
-
231
-
232
-
 233
233 -
 234
234 -
 235
235 -
 236
236 -
 237
237 -
 238
238 -
 239
239 -
 240
240 -
 241
241 -
 242
242 -
 243
243 -
 244
244 -
 245
245 -
 246
246 -
 247
247 -
 248
248 -
 249
249 -
 250
250 -
 251
251 -
 252
252 -
 253
253 -
254
-
255
-
256
-
257
-
258
-
259
-
260
-
261
-
262
-
263
-
264
-
265
-
266
-
267
-
268
-
269
-
270
-
271
-
272
-
273
-
274
-
275
-
276
-
277
-
278
-
279
-
280
-
281
-
282
-
283
-
284
 |
 |

233
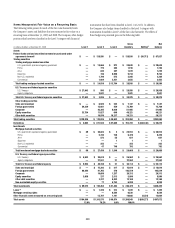
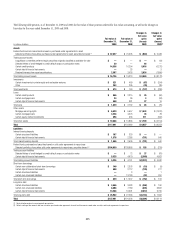
The decrease in Mortgage Servicing Rights of $2.7 billion was primarily •
attributed to mark-to-market losses recognized in the portfolio due to
decreases in the mortgage interest rates and increases in refinancing.
The increase in Securities sold under agreements to repurchase of $5 •
billion is driven by a $6.2 billion increase from net transfers in as the
continued credit crisis impacted the availability of observable inputs
for the underlying securities related to this liability. This was offset by a
reduction from net settlements of $1.4 billion.
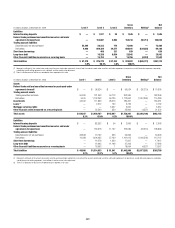
The decrease in short-term borrowings of $3.7 billion is due to net transfers •
out of $1.8 billion as valuation methodology inputs considered to be
unobservable were determined not to be significant to the overall valuation.
In addition, net payments of $1.8 billion were made during the year.
The increase in • long-term debt of $2.2 billion is driven by:
The net transfers in of $38.8 billion, substantially all of which related –
to the transfer of consolidated SIV debt in the first quarter of 2008, as
the availability of observable inputs continued to decline due to the
current crisis; offset by
$2.2 billion in gains recognized as credit spreads widened during the –
year; and
$34.3 billion decrease from net settlements/payments. Included in –
these settlements were $21 billion of payments made on maturing
SIV debt and the replacement of $17 billion of non-recourse,
consolidated SIV debt classified as Level 3 with Citigroup debt
classified as Level 2. This replacement occurred in connection with
the purchase of the SIV assets by the Company in November 2008.
Items Measured at Fair Value on a Nonrecurring Basis
Certain assets and liabilities are measured at fair value on a nonrecurring
basis and therefore are not included in the tables above.
These include assets measured at cost that have been written down to fair
value during the periods as a result of an impairment. In addition, these
assets include loans held-for-sale that are measured at LOCOM that were
recognized at fair value below cost at the end of the period.
The fair value of loans measured on a LOCOM basis is determined where
possible using quoted secondary-market prices. Such loans are generally
classified as Level 2 of the fair-value hierarchy given the level of activity in
the market and the frequency of available quotes. If no such quoted price
exists, the fair value of a loan is determined using quoted prices for a similar
asset or assets, adjusted for the specific attributes of that loan.
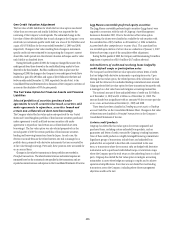
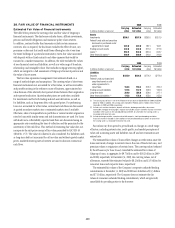
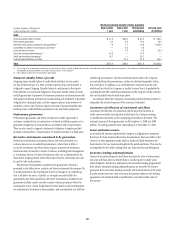
The following table presents all loans held-for-sale that are carried at
LOCOM as of December 31, 2009 and 2008 (in billions):
Aggregate
cost Fair value Level 2 Level 3
December 31, 2009 $2.5 $1.6 $0.3 $1.3
December 31, 2008 3.1 2.1 0.8 1.3